Figure 2.
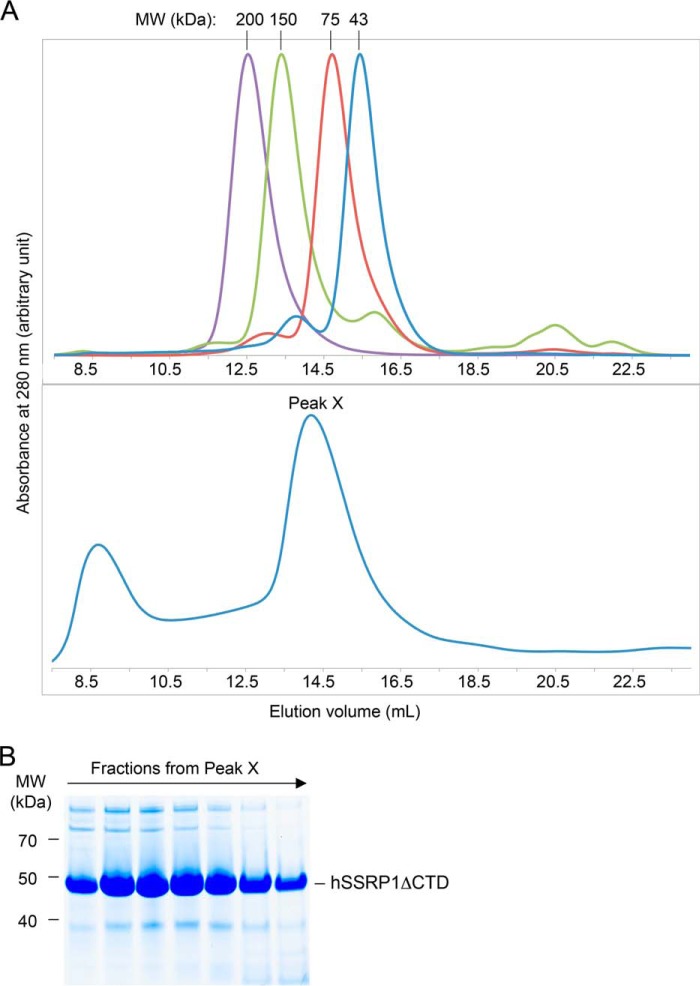
Analysis of hSSRP1 by gel-filtration chromatography. A, elution profile from an SD200 10/30 size-exclusion chromatography column of protein standards: β-amylase (200 kDa), alcohol dehydrogenase (150 kDa), ovalbumin (43 kDa) and conalbumin (75 kDa) (top panel) and hSSRP1ΔCTD. Peak X contains hSSRP1ΔCTD (bottom panel). B, SDS-PAGE of fractions from peak X in A, bottom panel.

