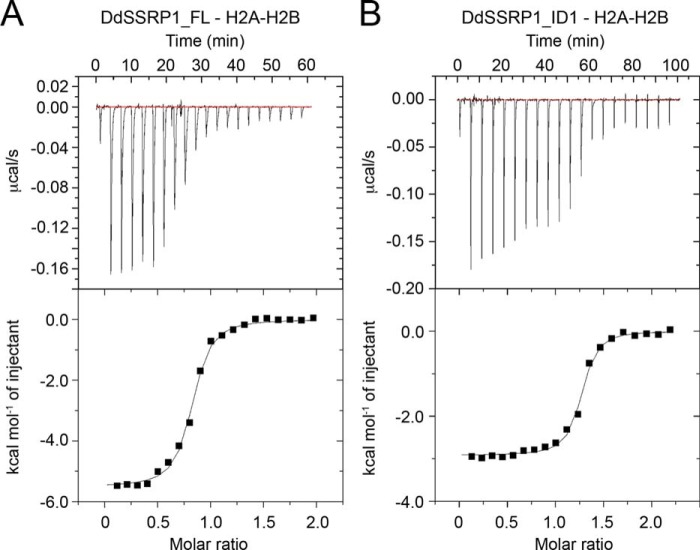
Figure 6.
ITC profiles of the interaction between DdSSRP1 ID1 region and histone H2A–H2B. A, DdSSRP1_FL-H2A–H2B binding profile. B, DdSSRP1_ID1-H2A–H2B binding profile. Raw data (top panel) and integrated data (bottom panel) are shown. The data shown are representative of one independent experiment.

