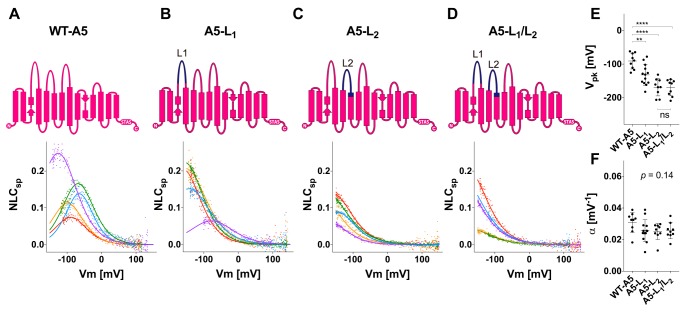
Figure 2.
NLC measurements for prestin and prestin-based constructs. A–D, schematic diagrams of WT prestin (WT-A5) (A) and prestin-based constructs (A5-L1 (B), A5-L2 (C), and A5-L1/L2 (D)) along with their representative NLCs. The parts of prestin and pendrin are indicated by magenta and dark blue, respectively, in the schematic diagrams. The magnitudes of NLCs (Cm − Clin) are corrected for cell size (Clin) because larger cells tend to express greater amounts of prestin in their cell membranes (NLCsp ≡ (Cm − Clin)/Clin). Different colors indicate individual recordings. A two-state Boltzmann model (see “Experimental procedures”) was used to interpret the NLC data (solid lines). E, the Vpk values (mean ± S.D.) are as follows: WT-A5, −91 ± 24 mV (n = 9); A5-L1, −132 ± 31 mV (n = 13); A5-L2, −169 ± 26 mV (n = 9); A5-L1/L2, −170 ± 24 mV (n = 9). The asterisks indicate the degree of statistical significance (**, p < 0.01; ****, p < 0.0001). Error bars represent S.D. ns, not significant. F, the α values (mean ± S.D.) are as follows: WT-A5, 0.031 ± 0.006 mV−1 (n = 9); A5-L1, 0.026 ± 0.007 mV−1 (n = 13); A5-L2, 0.025 ± 0.005 mV−1 (n = 9); A5-L1/L2, 0.026 ± 0.005 mV−1 (n = 9). Error bars represent S.D.

