Figure 4.
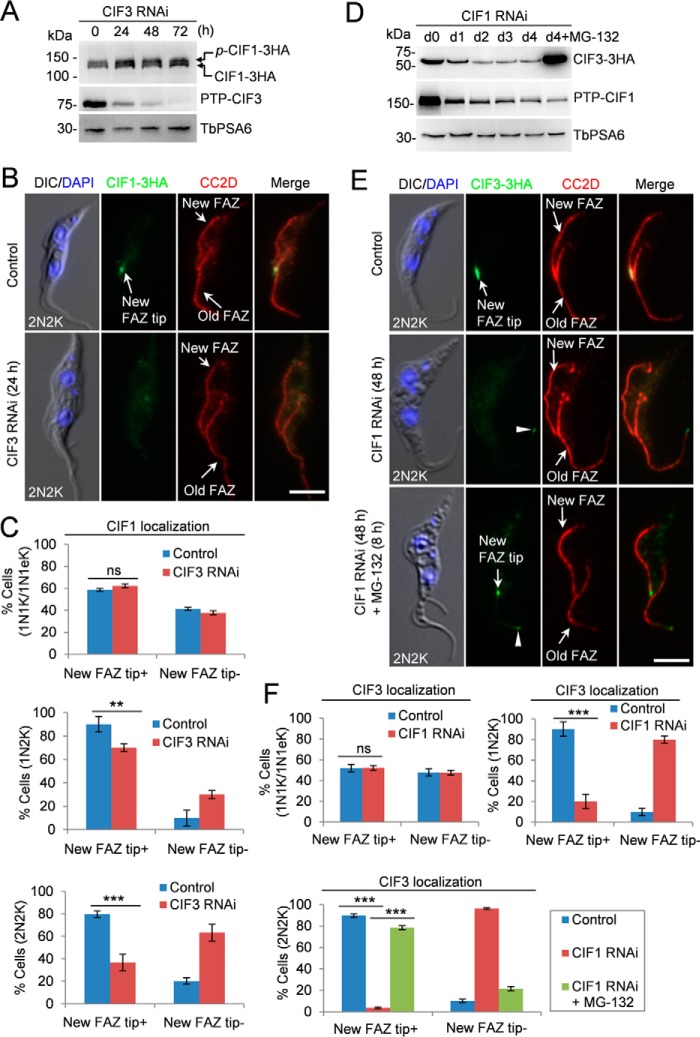
CIF3 maintains CIF1 localization and CIF1 maintains CIF3 stability. A, effect of CIF3 depletion on CIF1 protein level. CIF3 RNAi was induced for 72 h. TbPSA6 served as the loading control. p-CIF1–3HA, phosphorylated CIF1–3HA. B, depletion of CIF3 disrupted CIF1 localization to the new FAZ tip. Cells were co-immunostained with FITC-conjugated anti-HA mAb and anti-CC2D antibody to label CIF1–3HA and the FAZ, respectively. Scale bar: 5 μm. C, quantification of cells with different CIF1 localization patterns. Total numbers of cell counted are as follows: 1N1K/1N1eK, 213 (control) and 212 (CIF3 RNAi); 1N2K, 91 (control) and 90 (CIF3 RNAi); 2N2K, 158 (control) and 161 (CIF3 RNAi). The results were presented as mean percentage ± S.D. (n = 3). **, p < 0.01; ***, p < 0.001; ns, no statistical significance. D, effect of CIF1 depletion on CIF3 protein level. CIF1 RNAi was induced for 96 h. The proteasome inhibitor MG-132 was added after CIF1 RNAi was induced for 88 h and incubated for an additional 8 h. TbPSA6 served as the loading control. E, effect of CIF1 depletion on CIF3 localization. CIF1 RNAi was induced for 48 h. For MG-132 treatment, cells were induced for RNAi for 40 h and then treated with MG-132 for an additional 8 h. Cells were co-immunostained with FITC-conjugated anti-HA mAb and anti-CC2D antibody to label CIF3–3HA and the FAZ, respectively. The white arrowheads indicate the weak CIF3 fluorescence signal at the old FAZ tip. Scale bar: 5 μm. F, quantification of the cells with different CIF3 localization patterns. Total numbers of cells counted are as follows: 1N1K/1N1eK, 285 (control) and 261 (CIF1 RNAi); 1N2K, 153 (control) and 164 (CIF1 RNAi); 2N2K, 206 (control), 205 (CIF1 RNAi) and 203 (CIF1 RNAi+MG-132). The results were presented as mean percentage ± S.D. (n = 3). ***, p < 0.001; ns, no statistical significance.

