Figure 3.
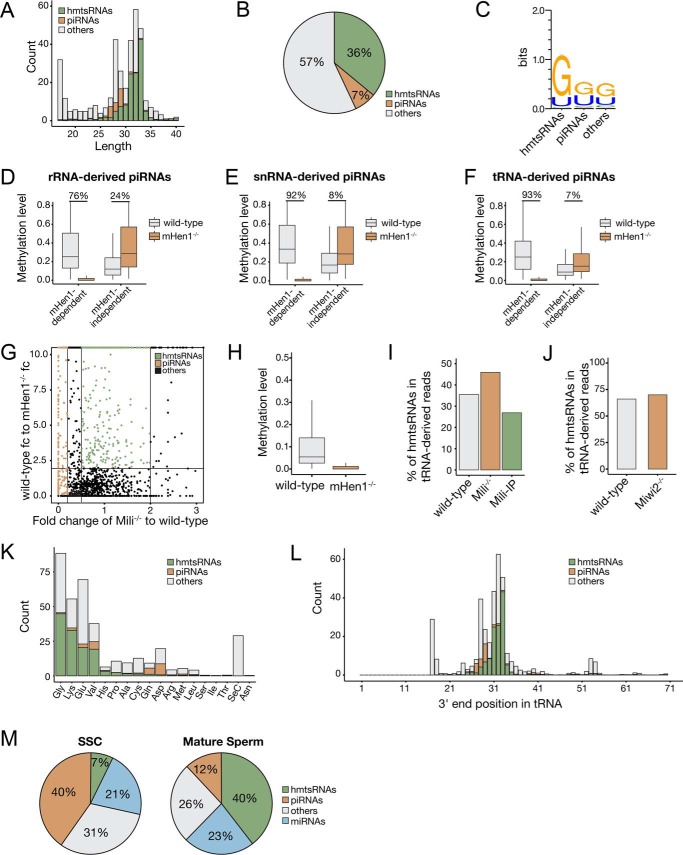
mHen1-dependent 3′-methylation of noncanonical piRNAs and hmtsRNAs in SSCs. A, length distribution of tRNA-derived sncRNAs. B, ratio of piRNAs and hmtsRNAs derived from tRNAs. C, 5′-end nucleotide bias of tRNA-derived piRNAs and hmtsRNAs. D–F, boxplots represent the mHen1-dependent or mHen1-independent methylation level of rRNA-derived (D), snRNA–derived (E), and tRNA-derived (F) piRNAs at 3′-end in WT and mHen1−/− SSCs. G, dependences of the small RNAs derived from tRNAs. x axis represents the abundance change of sncRNAs in Mili−/− versus WT SSCs. y axis represents the methylation level change of sncRNAs in WT versus mHen1−/− SSC. Brown dots represent piRNAs, which were Mili-dependent. Green dots represent hmtsRNAs, which were mHen1-dependent but not Mili-dependent. H, methylation level of hmtsRNA in WT and mHen1−/− SSC. I, percentage of hmtsRNAs in tRNA-derived sncRNAs in the WT SSCs, Mili−/− SSCs, and Mili-IP of WT SSCs. J, percentage of hmtsRNAs in tRNA-derived sncRNAs in the WT and Miwi2−/− SSCs. K, abundance (count) of piRNAs and hmtsRNAs originating from each tRNA. L, 3′-end position of tRNA-derived piRNAs and hmtsRNA mapped on the intact tRNAs. The x axis represents the nucleotide position of intact tRNAs. K and L, abundance of sncRNAs was corrected by methylated spike-in normalization. M, relative abundance of different sncRNAs in WT SSC and mature sperm in mouse.

