
Figure 4.
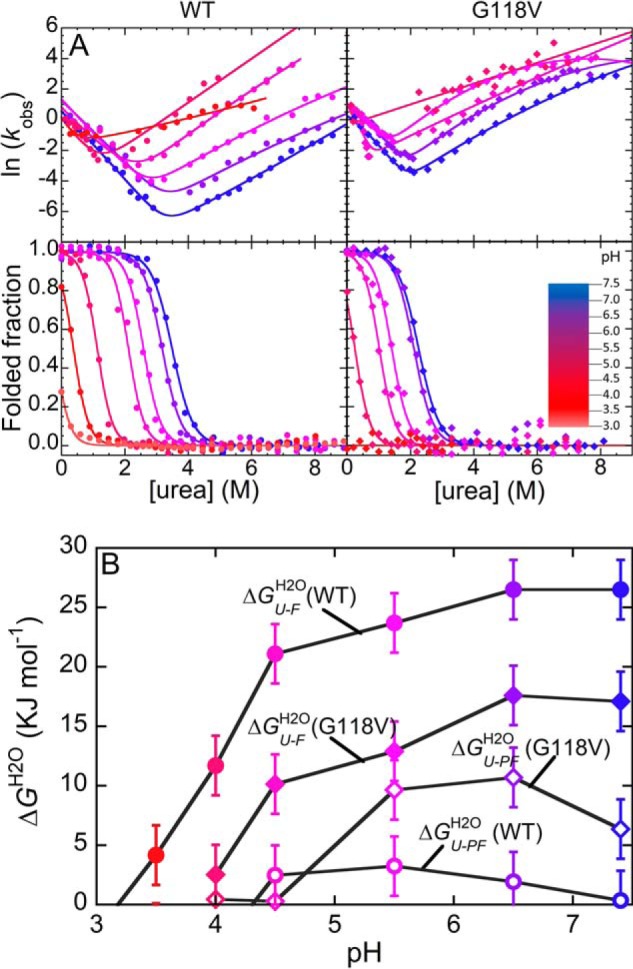
A, chevron plots (top panels) and equilibrium unfolding curves (bottom panels) for WT (circles, left panels) and G118V (diamonds, right panels) profilin-1, carried out at different pH values. As indicated by the color scale, color varies from blue to red as pH decreases from 7.0 to 3.0. B, conformational stabilities, calculated as free energy change following conversion into U for the PF (ΔGU–PFH2O, empty symbols) and F (ΔGU–FH2O, filled symbols) states of WT (circles) and G118V (diamonds) profilin-1. Error bars, S.D.