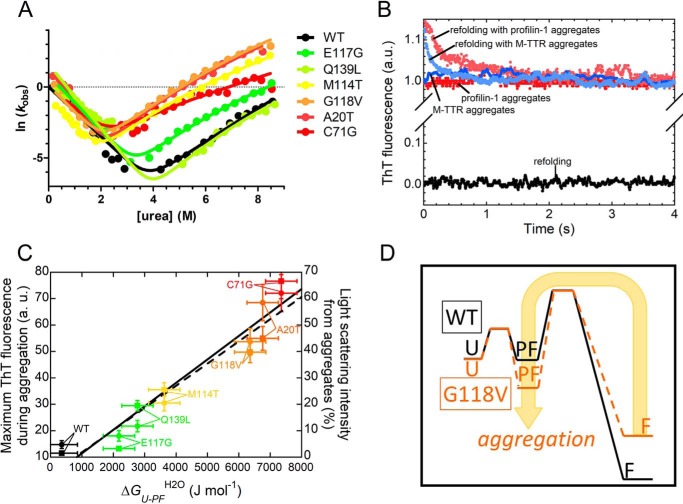
Figure 5.
A, global fitting procedure of the chevron plots measured for the indicated profilin-1 variants. The possibility to fit all of the chevron plots with shared βT values illustrates that all folding/unfolding data can be interpreted using the same model. In this case, we obtained βT1 = 0.59 ± 0.02 and βT2 = 0.79 ± 0.03 (fit errors). B, ThT emission during refolding of WT profilin-1 in the absence (black) or presence of preformed aggregates of profilin-1 (pink) or M-TTR (cyan). Control traces in the absence of refolding profilin-1 but in the presence of aggregates of profilin-1 (red) or M-TTR (blue) are shown. C, correlation between aggregation propensity, represented by the plateau ThT signal observed following aggregation (circles; linear fit shown as a continuous line) or by the percentage of light scattering intensity of the aggregates (squares; linear fit shown as a dashed line) and conformational stability of PF state, represented by ΔGU–PFH2O (p < 0.01 in both cases). The former values were obtained previously (15, 16). The color scale is as in A. D, comparison between the energy profiles for refolding of the WT and an aggregation-prone variant (e.g. G118V); the scheme illustrates that in the latter case, a more accessible aggregation-prone PF state favors aggregation.

