Figure 5.
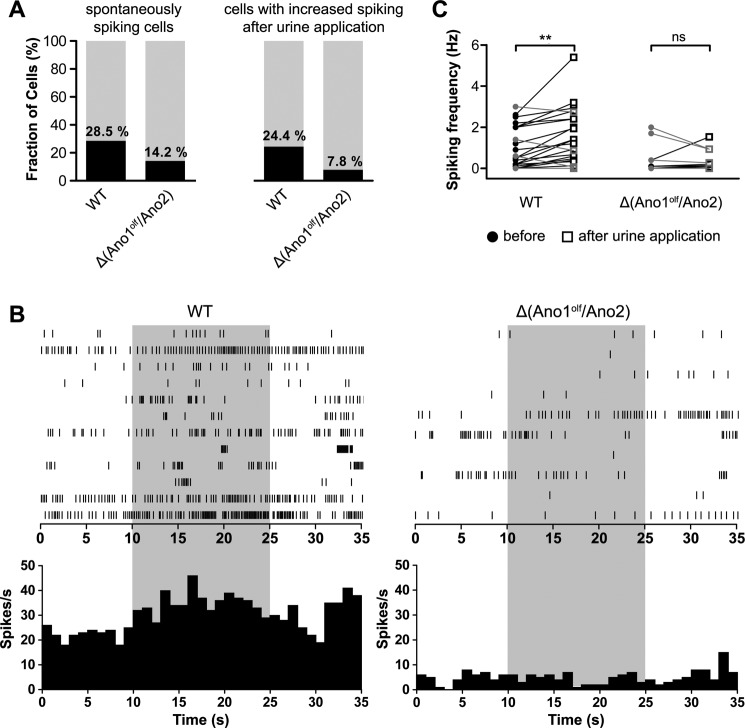
Stimulus-evoked spiking of vomeronasal sensory neurons. A, graphical representation of spontaneously firing cells among all recorded VSNs (left panel) and cells responsive to the urine stimulus among all stimulated VSNs (right panel); genotypes are indicated. B, raster plots (upper panels) and PSTHs (lower panels) of spiking in WT and Δ(Ano1olf/Ano2) VSNs upon stimulation with urine (1:200, indicated in light gray). Raster plot of WT does not show all recorded cells for clarity; PSTHs include data of all cells. C, VSN firing frequency before (filled circles, 0–10 s) and upon stimulation with diluted urine (1:200, white squares, 10–25 s). Only data from VSNs that displayed at least one action potential during the recording period are shown (WT: 20 of 82 cells, Δ(Ano1olf/Ano2): 7 of 90 cells). Connected data points were recorded from the same VSN. The cells that showed increased firing are indicated in black; others are in gray. Increase is significant in WT (p < 0.0005) but insignificant in Δ(Ano1olf/Ano2). Paired samples t test was used. ns, p > 0.05 (not significant); **, p ≤ 0.01.

