
Figure 4.
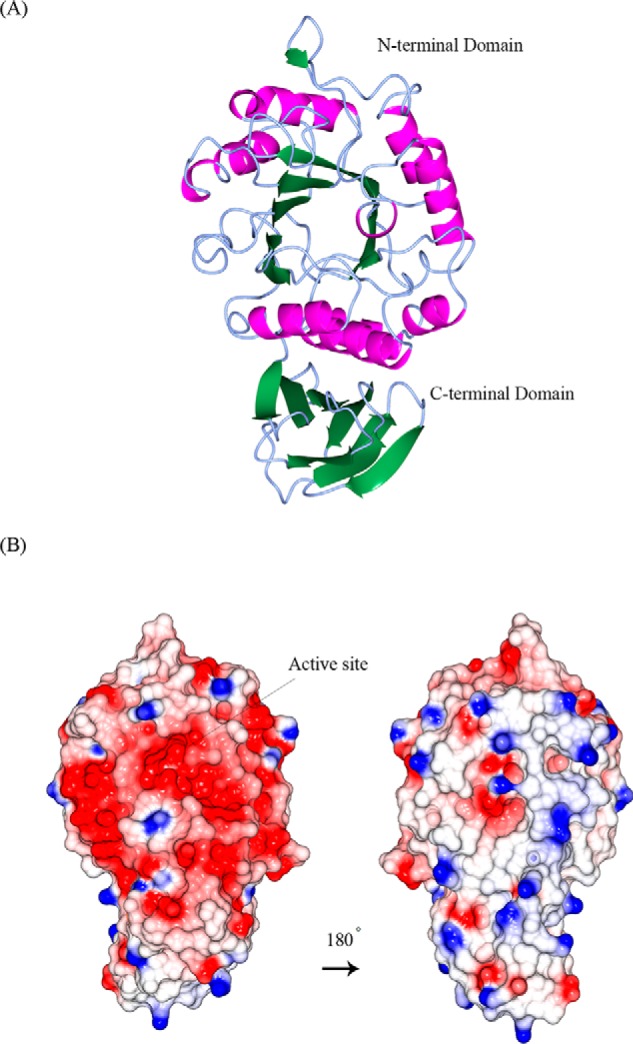


Structural similarities of α-galactosidases from different species. A, stereo view of the ribbon model of A1.1 (PDB code 6F4C). Catalytic domain contains a (β/α)8-barrel. C-terminal domain forms a Greek key. β-Strands are represented in green; α-helices are represented in pink; and loops are represented in light blue. B, electrostatic map of A1.1: red indicates the − charges; blue indicates the + charges. C, multiple amino acid sequence alignment of A1.1: human, rice, and coffee galactosidases. The sequence alignment showing structural details of A1.1 was achieved using ESPript3.0. α-Helices are shown as coils labeled α; β-strands are shown as arrows labeled β, and β-turns are labeled TT. Identical residues are shown on a red background; conserved residues are shown in red, and conserved regions are shown as blue boxes. The catalytic residues are indicated with an asterisk. D, right panel, stereo view of the superimposed models of A1.1 with the human α-galactosidase. 348 residues were aligned, having a root-mean-square deviation of 1.3358 Å of their C-α atoms. The A1.1 model (PDB code 6F4C) is shown in green; the human α-Gal model (PDB code 3HG2) is shown in gray. The backbone of a modeled galactose molecule is shown in white, and its oxygen atoms are shown in red. Left panel, a closer look at the amino acids around the active site of both enzymes, presented as fat bonds.