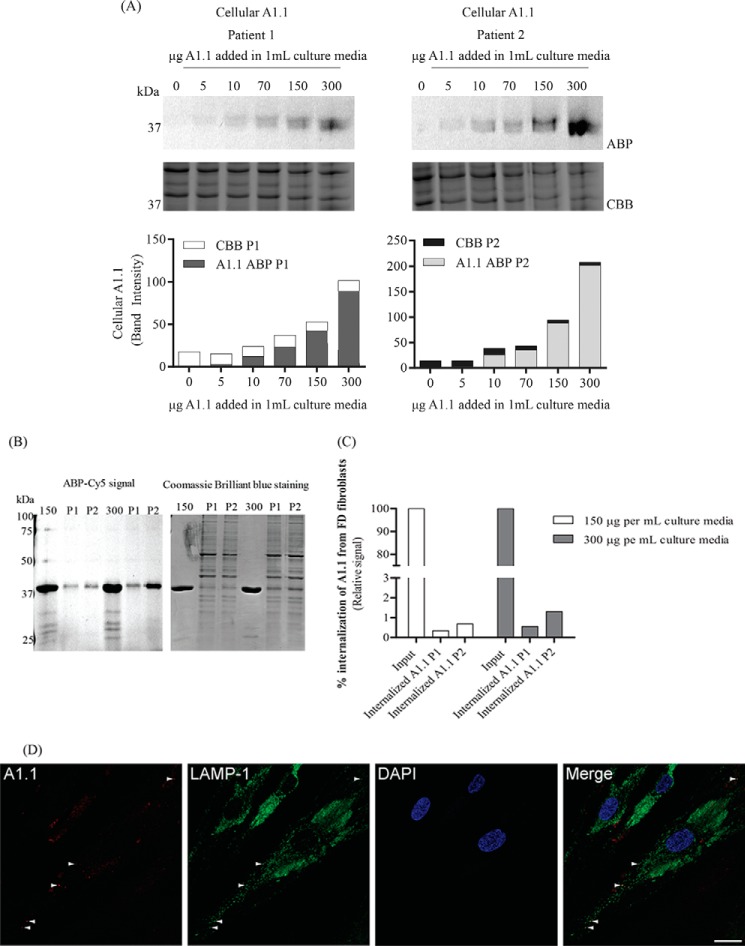
Figure 6.
Internalization of TB474-labeled A1.1 from Fabry fibroblasts. A, Fabry fibroblasts from two different patients were grown in 12-well plates. The cells were incubated with different amounts pre-labeled with TB474, A1.1 (0, 5, 10, 70, 150, and 300 μg per 1 ml of culture media). Lysis of the cells took place, and samples were measured for Cy5 signal, through SDS-PAGE. Left top panel, results were obtained when using patient 1 cell line, SDS-polyacrylamide gel image, following fluorescent scanning and quantification of signal, left bottom panel. Right panel, results obtained from patient 2 cell line. The gels were conducted more than once. The uptake is gradually increased while increasing the amount of pre-labeled protein in both cell lines. 10 μg of total fibroblast protein was added in each well. Coomassie staining of the cells took place to show equal loading. ABP = activity-based probe signal; CBB = Coomassie Brilliant Blue signal; P1 = patient 1; P2 = patient 2. B, estimation of the % of the internalization of pre-labeled A1.1 (150 and 300 μg per ml of culture media) from the same FD fibroblasts. Loaded on gel, 1% of the pre-labeled A1.1 input, together with 10 μg of total fibroblast protein, accounted for 13–17% of the total cell lysate. C, quantification of signal obtained in B. The uptake of 150 μg of A1.1 accounts to 0.3–0.5% of the total input and 0.5–1% when using 300 μg. ABP = activity-based probe signal; P1 = patient 1; P2 = patient 2. D, overnight uptake of A1.1, pre-labeled with TB474, by FD fibroblasts monitored by confocal microscopy. Cells were grown overnight on glass coverslips and incubated with 150 μg of pre-labeled A1.1 per ml of culture medium (here shown cells from patient 1). Panel in red, visualization of the internalized TB474-labeled A1.1. Panel in green, lysosomal labeling using anti-LAMP-1 antibody. Panel in blue, cellular nuclei stained with DAPI. D, overlay image. The white arrowheads indicate examples of co-localization of internalized TB474-labeled A1.1 with the late endosomal/lysosomal marker LAMP-1. Scale bar 25 μm.

