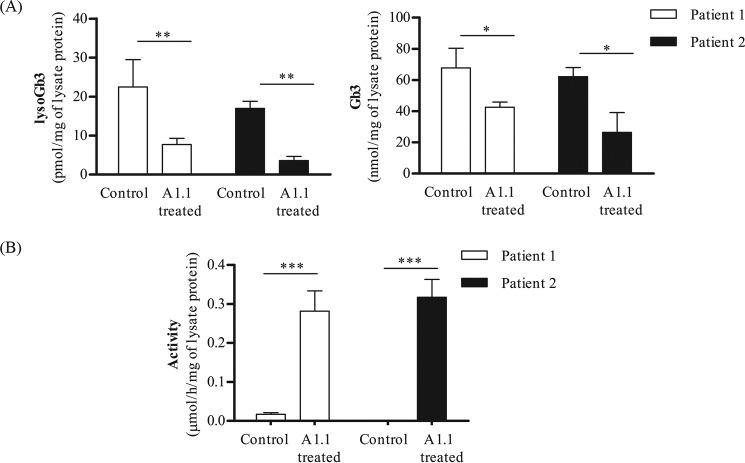
Figure 7.
Correction of FD lipid abnormalities in Fabry fibroblasts via A1.1 treatment. A, lyso-Gb3 and Gb3 levels measured by LC-MS/MS in Fabry fibroblasts from two different patients, with or without overnight treatment with 300 μg of A1.1 per ml of culture medium. B, cellular 4MU–α-Gal activity found in the same lysates that were used for lipid measurements, before and after treatment with A1.1. Data are represented as mean ± S.D., n ≥ 3. Asterisk(s) indicate significant differences as measured by a standard t test: *, p < 0.05; **, p < 0.01; ***, p < 0.001.

