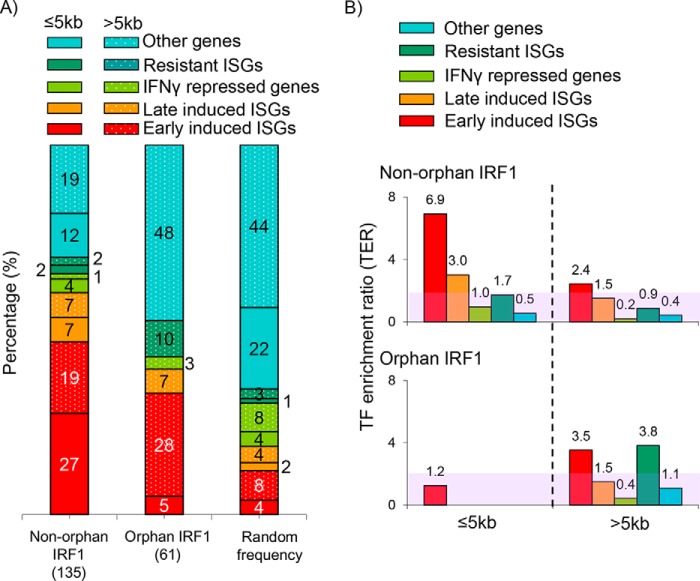
Figure 4.
Orphan IRF1 sites are skewed to remote sites of ISGs. A, histogram shows the percentages of nonorphan (productive) and orphan IRF1 sites or an equal number of randomly generated sites at proximal (≤5 kb) or distal (>5 kb) sites of the indicated classes of IFNγ affected genes or other genes unaffected by IFNγ. The number of sites in each category is indicated in parentheses. Random frequency indicates the distribution of 135 randomly generated sites. B, distribution of IRF1 sites normalized to random controls. The number of IRF1 sites from ChIP-chip data, or random computer-generated sites near to each gene class are determined, and the ratio of the former over the latter provides the TER. The unshaded region indicates TER >2-fold.

