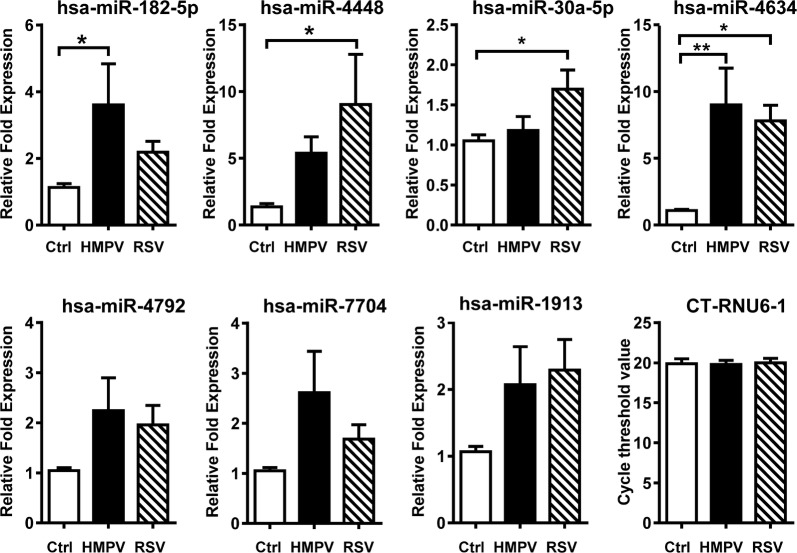
Fig. 2.
Profile of miRNAs upregulated in MoDCs infected by HMPV and RSV. Cells were infected at MOI of 3 for 24 h; miRNAs expression was assayed by qRT-PCR. Graph bars represent mean of 13 independent donors ± SEM. Statistical significant differences between infected and uninfected cells were calculated by one-way analysis of variance (ANOVA) followed by Dunet post-test and are indicated *P < 0.05; **P < 0.01

