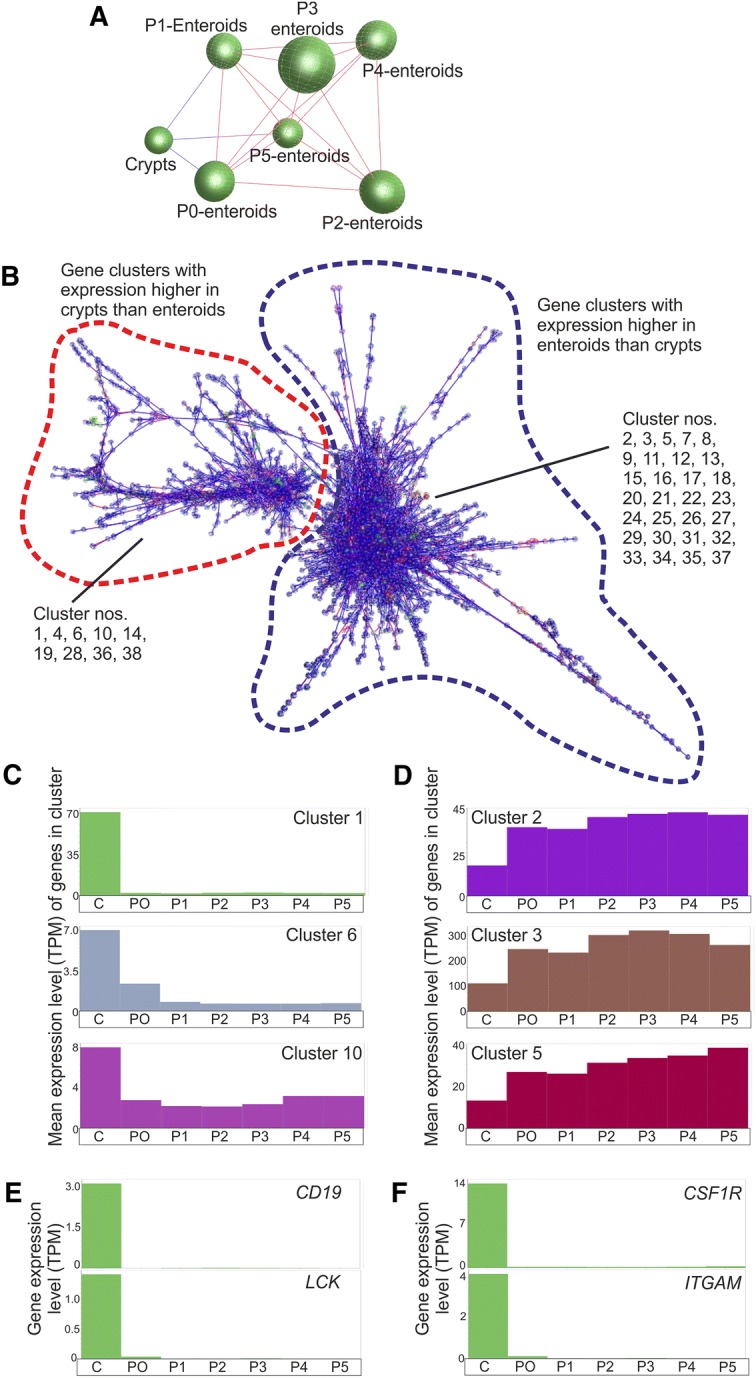
Figure 5.

Network analysis of mRNA-seq expression data derived from isolated bovine intestinal crypts and enteroids. A Clustering of samples based on their global gene expression profile. A Pearson correlation matrix was prepared by comparing data derived from all seven data sets samples. A network graph was then constructed using sample-to-sample Pearson relationships greater than r ≥ 0.96. Here, the nodes represent individual mRNA-seq data sets. The edges represent the connections between data sets and are coloured according to the strength of the correlation (red, r = 1.0; blue, r ≥ 0.96). P, enteroid passage number. B Main component of the network graph derived from all seven data sets samples. Here, the nodes represent transcripts (genes) and the edges represent correlations between individual expression profiles above r ≥ 0.99. Red broken line, region of network graph containing clusters of genes predominantly expressed at higher levels in isolated intestinal crypts. Blue broken line, region of network graph containing clusters of genes predominantly expressed at higher levels in enteroids. C, D The mean expression profiles of the genes in selected clusters across the seven data sets. The x axis shows the samples ordered as follows: C, isolated intestinal crypts; P0, freshly prepared enteroids; P1, passage 1 enteroids, etc. The y axis shows the mean expression intensity (transcripts/million reads, TPM) for the cluster. C Clusters with mean expression high crypts compared to enteroids. D Clusters with mean expression high enteroids compared to crypts. E, F Comparison of CD19, CSF1R, LCK and ITGAM expression across the individual data sets.
