FIG 5.
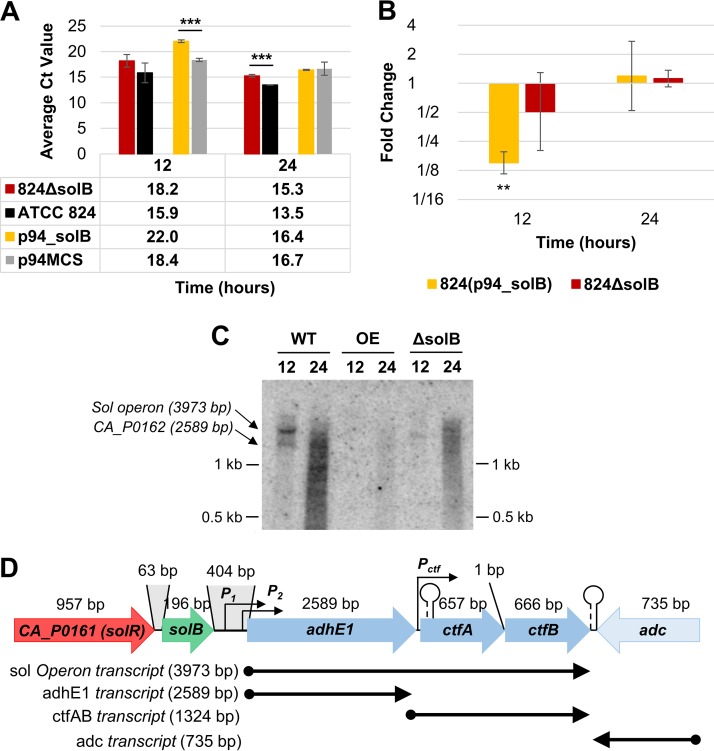
Expression analysis of adhE1. (A) Average raw CT values (n = 3) from Q-RT-PCR analysis of adhE1 transcript levels (the average CT value for adhE1 in nontemplate controls was 29.58 ± 0.12). (B) Fold changes in adhE1 expression in 824(p94_solB) and 824 ΔsolB [relative to the expression levels in 824(p94) and the WT, respectively], derived from Q-RT-PCR analysis. All error bars represent SD (n = 3). **, P ≤ 0.01; ***, P ≤ 0.001 (two-tailed, unpaired t test). (C) Northern blot analysis of adhE1 expression at 12 and 24 h, revealing expression both as part of the polycistronic sol operon and as a single transcript, using 15 μg of total RNA. (D) Schematic of solB and the sol-locus genes, showing labels for the distal and proximal sol operon promoters (P1 and P2), the putative ctfA-ctfB promoter (Pctf), the hairpin Rho-independent terminator starting 36 bp into the ctfA coding sequence, and the strong bidirectional Rho-independent terminator between ctfB and the convergent adc gene. Also indicated are the proposed transcripts of sol operon genes (lengths listed; not drawn to scale), which are supported by RNA-seq data (9) (see Fig. S4 in the supplemental material).

