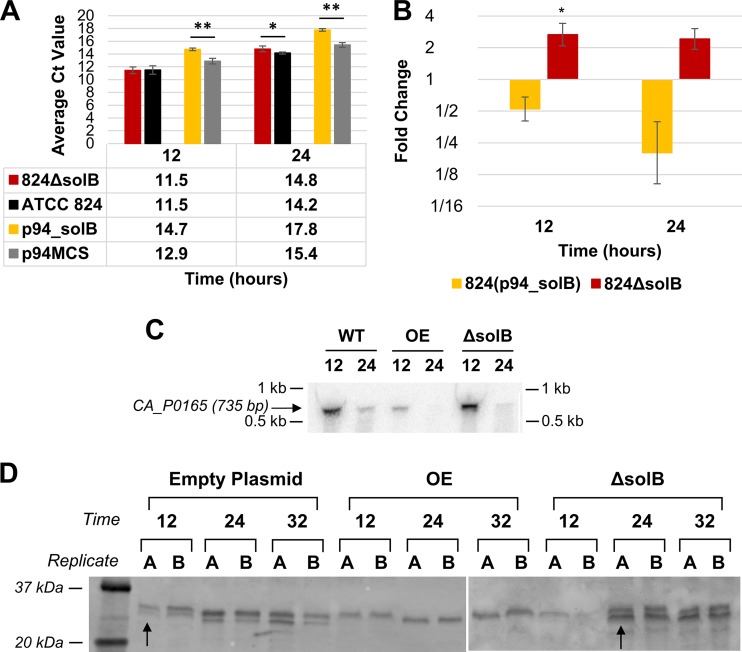
FIG 7.
Expression analysis of adc. (A) Average raw CT values (n = 3) from Q-RT-PCR analysis of adc transcript levels (the average CT value for adc in nontemplate controls was 30.53 ± 0.17). (B) Fold changes in adc expression in 824(p94_solB) and 824 ΔsolB [relative to the expression levels in 824(p94MCS) and the WT, respectively], derived from Q-RT-PCR analysis. All error bars represent SD (n = 3). **, P ≤ 0.01; ***, P ≤ 0.001 (two-tailed, unpaired t test). (C) Northern blot analysis of adc expression at 12 and 24 h. (D) Western blot analysis of AADC protein expression (lower band, as previously verified [43]), using 50-μg samples, primary antisera diluted 1:250, and secondary antisera diluted 1:10,000. Panel D is a combination of images of two separate gels/membranes, since it was not possible to fit all lanes in one gel.

