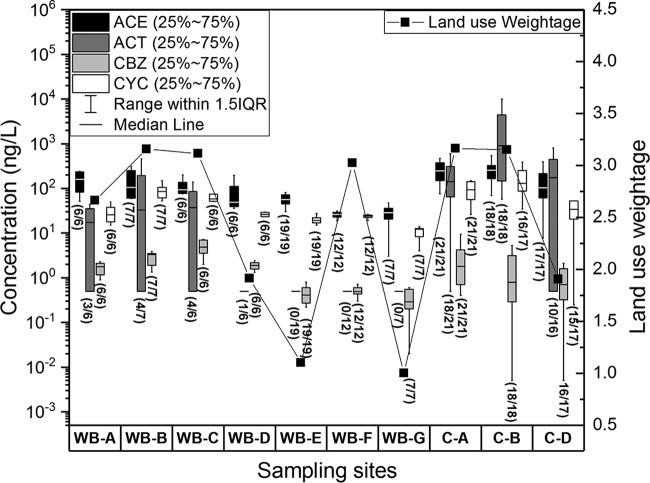
FIG 2.
Box plot concentrations of selected chemical tracers in different water bodies and catchments (different sampling points within the same location are merged for simplicity). The median value is represented by the line inside the box, which indicates the range (25% to 75%). The solid line (■) shows the land use weightage at different sampling points. The higher weightage of land use category means that the areas are more impacted by anthropogenic activities. All the samples, including the nondetect samples with ROS imputed values, are shown in the plots. Numbers in parentheses show the detection frequency of different selected chemicals at different sampling sites as the number of positive samples over the total number of samples at each site.

