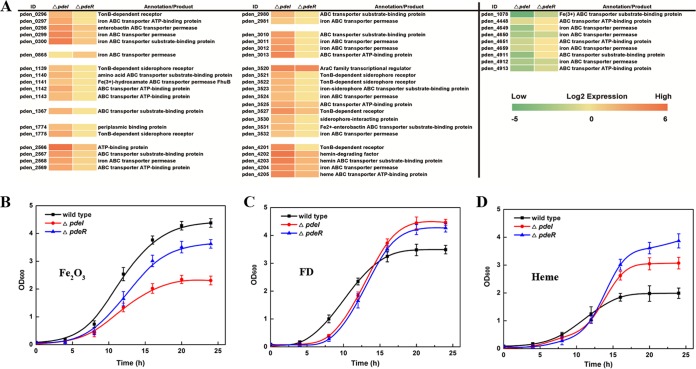
FIG 3.
(A) Gene expression patterns of the iron uptake-related ABC transporter systems. The data were visualized as a heatmap. Genes differentially expressed between the ΔpdeI mutant and wild-type strain and between the ΔpdeR mutant and wild-type strain are listed in the map. Each column of the heatmap represents the log2 FC value in expression, with a green-yellow-red scheme in which the lower limit is −5 and the upper limit is 6. (B) Growth curves of the wild type and QS-defective mutants in medium with Fe2O3 only. (C) Growth curves of the wild type and QS-defective mutants in medium with dicitrate-chelated iron (ferric dicitrate [FD]) only. (D) Growth curves of the wild type and QS-defective mutants in medium with heme only.

