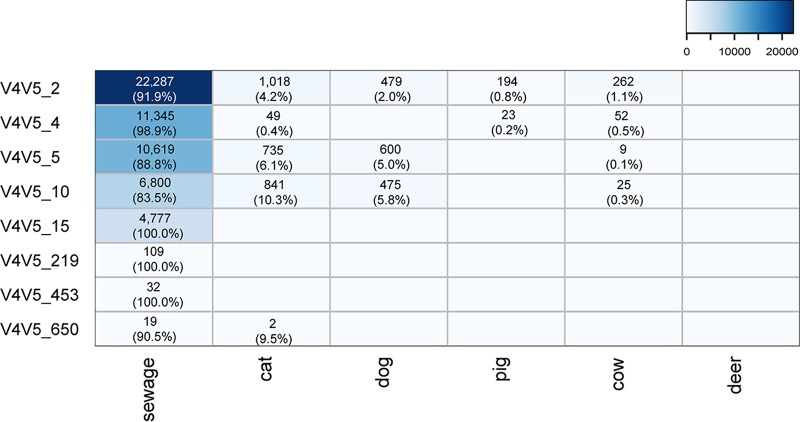
FIG 3.
Abundances of Lachno3-associated V4V5 sequence types in sewage and five animal hosts. The abundance shown in each cell is normalized to the median sequence count for all samples and is converted to a percentage according to each V4V5 type's total abundance. The values increase from white to blue.

