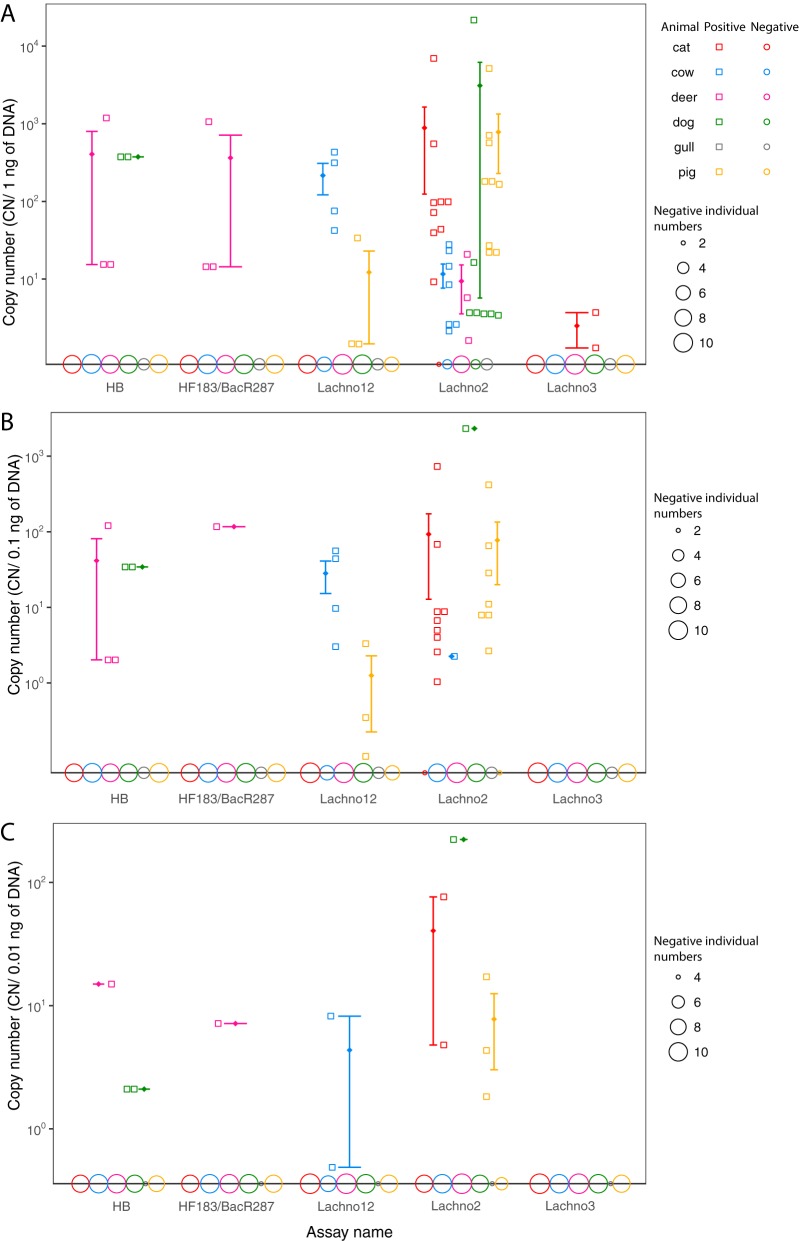
FIG 4.
qPCR validation of the results for animal fecal samples obtained with the Lachno3, Lachno12, Lachno2, HB, and HF183/BacR287 assays. The y axis indicates the copy numbers, and the x axis shows the assay names. The results obtained with 1 ng μl−1 (A), 0.1 ng μl−1 (B), and 0.01 ng μl−1 (C) animal fecal DNA are shown. The results for different animals are shown in different colors, with those for pools being represented as two adjacent data points. The result for each positive sample is shown as a hollow square, and the results for all negative samples are shown as open circles on the x axis, with the sizes of the circles being directly proportional to the CN for each animal. The error bars represent the mean CN (shown as a rhombus) with the standard error.

