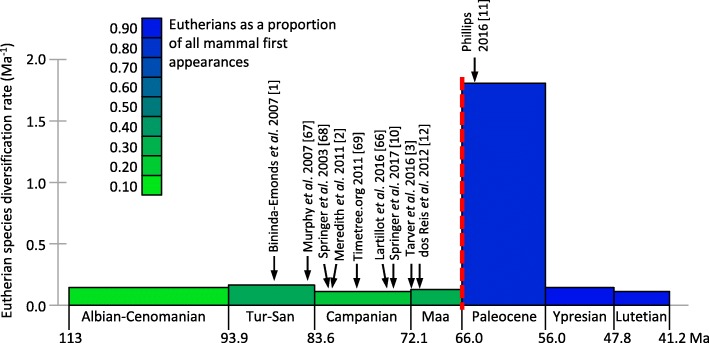
Fig. 1.
Eutherian fossil record species diversification rate. Data points are calculated as new appearances/Ma (scaled by species richness in the previous time bin, a proxy for starting species richness). Barremian-Aptian provides the previous time bin for Albian-Cenomanian. The green-blue colour shading indicates the proportion of eutherians among mammal first appearances for each time bin. Referenced arrows indicate molecular dating estimates for the temporal midpoint of the placental interordinal diversification, including for Laurasiatheria, Euarchontoglires and Afrotheria (See Additional file 2: Table S2). The KPg boundary is shown as red dashes. Tur-San, Turonian to Santonian; Maa, Maastrichtian [1–3], [10–12] [66–69]

