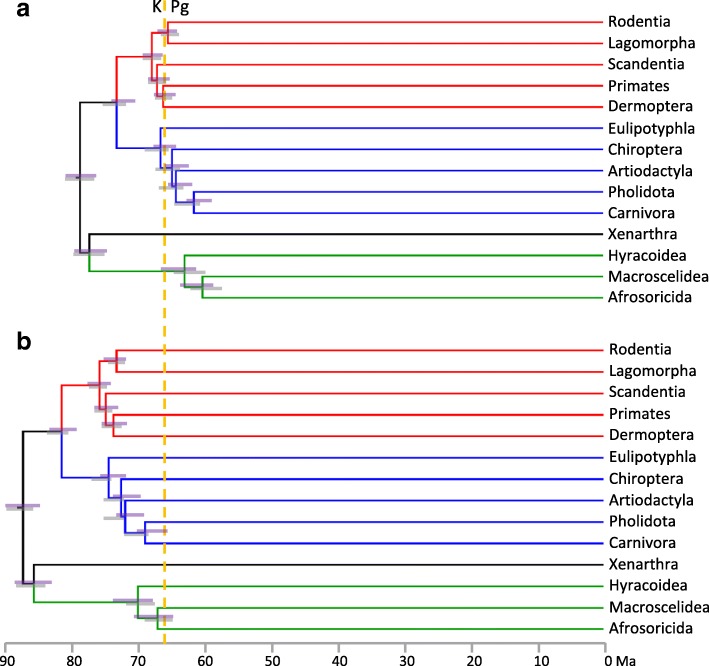
Fig. 3.
Placental mammal ordinal-level timetrees on the 122-taxon dataset for which large, long-lived taxa are excluded. Node heights are averaged over MCMCtree independent and autocorrelated rates analyses, with 95% CIs shown for analyses under independent rates (purple bars) and autocorrelated rates (grey bars). a. using our dR40 calibration set. b. Adding additional poorly-vetted calibrations for Lorisiformes, Lagomorpha, Emballonuroidea and Erinaceidae-Soricidae, and with maximum bounds for basal Primates, Rodentia and Chiroptera increased, following Springer et al. [10]. Substituting in these “dR40Springer” calibrations inflates the midpoint for the primary placental interordinal diversification from 64.5 Ma to 72.2 Ma

