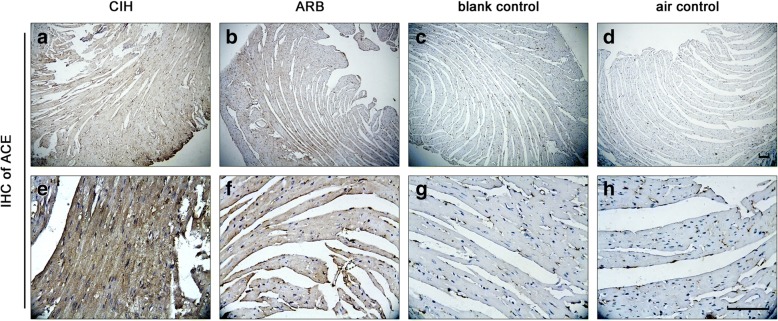
Fig. 1.
ACE staining in myocardial cells of mice from four experimental groups. a & b: CIH group; c & d: ARB group; e & f:blank control group; g & h: air control group. Immunohistochemistry was performed on the cardiac apex sections as described in Materials and methods. CIH and ARB groups showed highest ACE staining in CIH group followed by ARB group compared with the two control groups although this reduction did not reach statistical significance. Magnification: a, c, e and g: 100×; b, d, f and h: 400×. scale bar,100 μm

