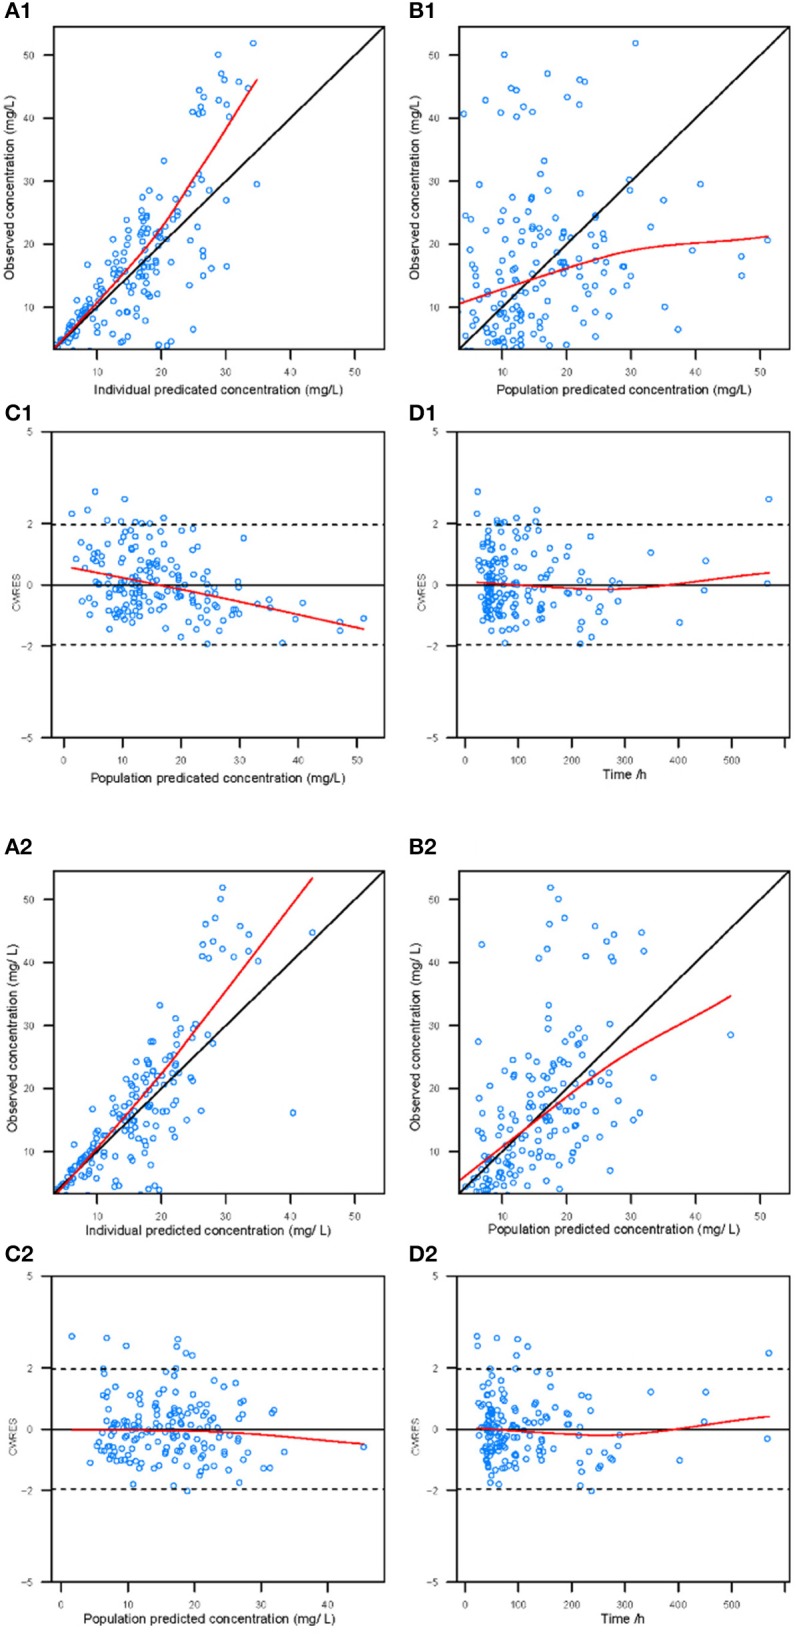
Figure 1.

Diagnostic goodness-of-fit plots for the base model (1) and the final model (2). (A) The individual predicted concentration (IPRED) vs. the observed concentration. (B) The population predicted concentration (PRED) vs. the observed concentration. (C) The PRED vs. the conditional weighted residual errors (CWRES). (D) The time after dose vs. CWRES. The black solid lines are the reference lines, and red solid lines are the loess smooth lines.
