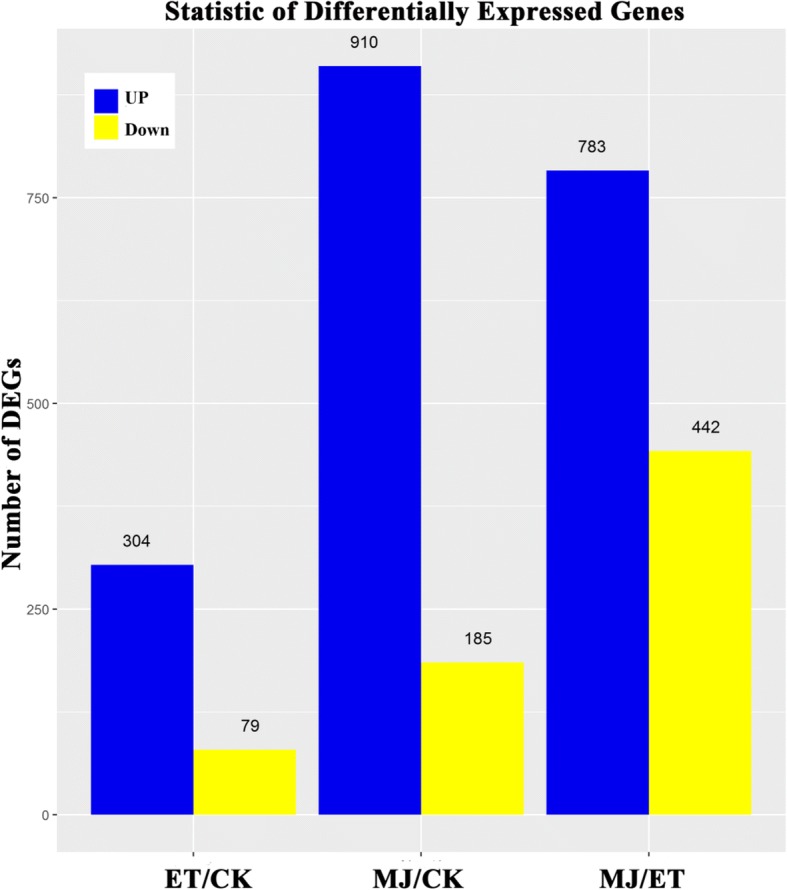
Fig. 1.

Differential expression analysis of C. roseus transcriptome. Statistical chart of DEGs of transcriptomes in response to hormone stress. Compared with the transcriptional level of control (CK, non-treatment), ET and MeJA, 304, 910, and 783 genes were up-regulated, and 79, 185, and 442 genes were down-regulated, respectively. The number of up-regulated genes was shown in blue, while down-regulated genes were shown in yellow
