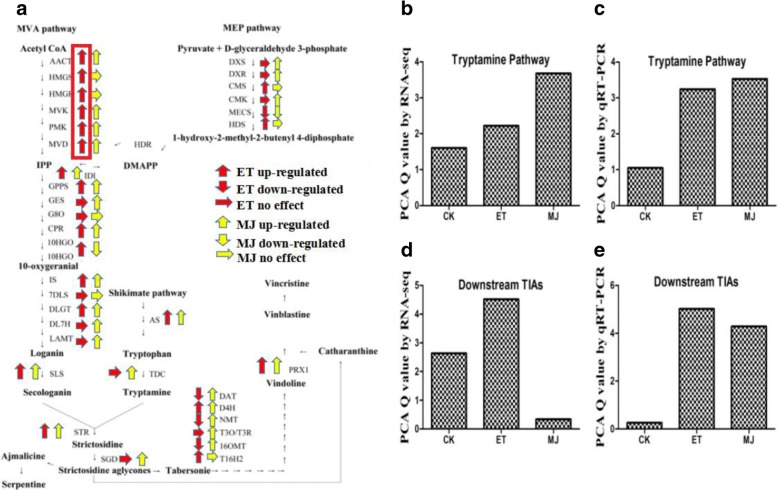
Fig. 3.
TIA pathway genes expression (by RNA-seq) in response to ET and MeJA treatment. Pathways led to the production of TIAs in C. roseus. a red arrows denoted ET regulation and yellow arrows denoted MeJA regulation, respectively. b Score plot of PCA by RNA-seq (Tryptamine pathway genes). c Score plot of PCA by qRT-PCR (Tryptamine pathway genes). d Score plot of PCA by RNA-seq (Downstream TIAs genes). e Score plot of PCA by qRT-PCR (Downstream TIAs genes)

