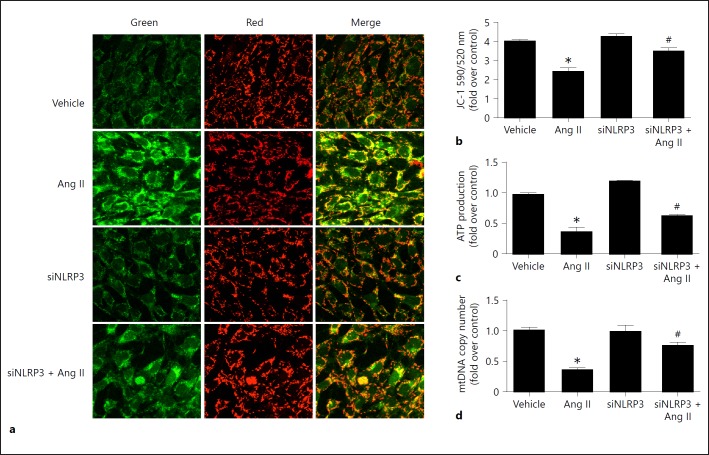
Fig. 5.
Knockdown of NLRP3 attenuated angiotensin II (Ang II)-induced mitochondrial dysfunction. Cells were grown on 6-well plates until 30% confluence and transfected with siNLRP3 for 24 h, then treated with Ang II (10–6 mol/L) for another 24 h. a Representative images of JC-1 staining. b Quantitation of JC-1 fluorescence by flow cytometry. c ATP content was detected as described in the Methods section. d qRT-PCR analysis of the mtDNA copy number. Data are presented as means ± SE (n = 6). * p < 0.05 vs. vehicle group; # p < 0.05 vs. Ang II-treated group.

