Fig. 3.
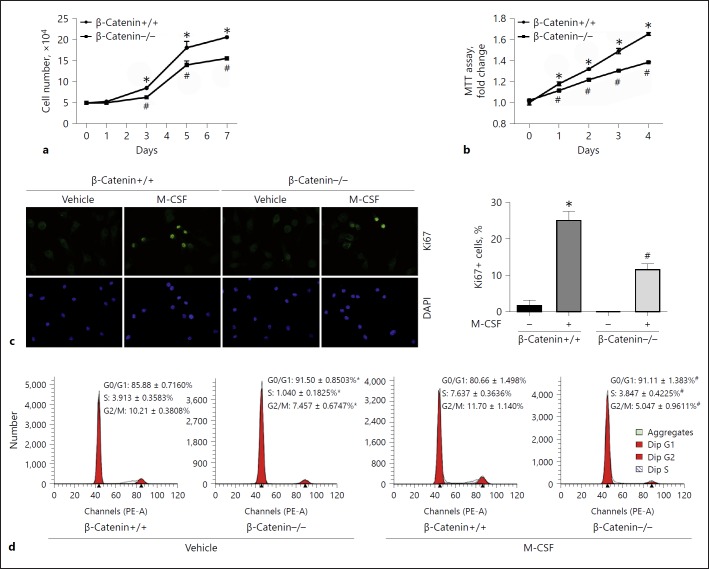
Ablation of β-catenin in macrophage reduces macrophage proliferation. a, b Cell counting (a) and MTT assay (b) in β- catenin+/+ or β-catenin–/– BMMs. * p < 0.05 versus β-catenin+/+ BMMs at day 0, n = 5; #p < 0.05 versus β-catenin+/+ BMMs at the respective time, n = 5. c Representative immunofluorescent staining images (left) and quantitative analysis (right) for Ki67 in β-catenin+/+ and β-catenin–/– BMMs. * p < 0.05 versus β-ca tenin+/+ BMMs treated with vehicle alone, n = 3; #p < 0.05 versus β-catenin+/+ BMMs treated with M-CSF, n = 3. Cells were stained with DAPI to visualize the nuclei. d FACS analysis showing cell cycle for β-catenin+/+ and β-catenin–/– BMMs. * p < 0.05 versus β-catenin+/+ BMMs treated with vehicle alone, n = 3; #p < 0.05 versus β-catenin+/+ BMMs treated with M-CSF (10 ng/mL), n = 3. BMMs, bone marrow-derived macrophages; DAPI, 4′,6-diamidino-2-phenylindole; M-CSF, macrophage colony-stimulating factor; MTT, 3-(4,5-dimethylthiazol-2-yl)-2-5-diphenyltetrazolium bromide.

