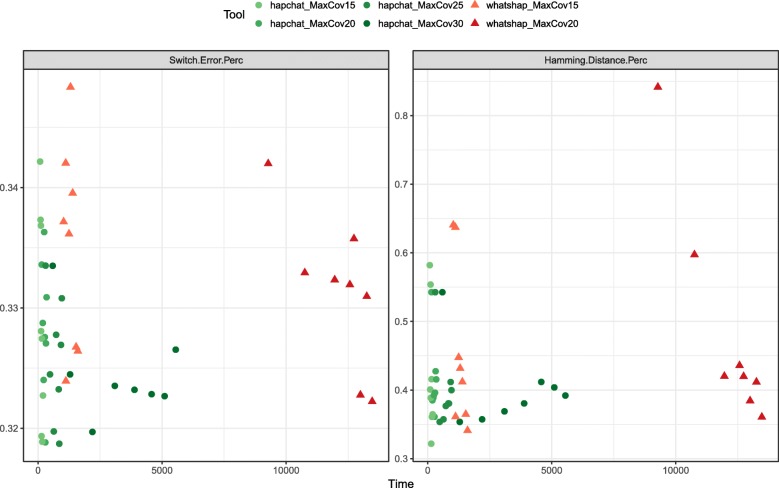
Fig. 1.
Switch error rate and Hamming distance as a function of running time. As achieved by HapCHAT and WhatsHap at different maximum coverages on the real Ashkenazim Chromosome 1 dataset. For each tool and each maximum coverage, we represent a point for each of the 8 possible values of the average coverage

