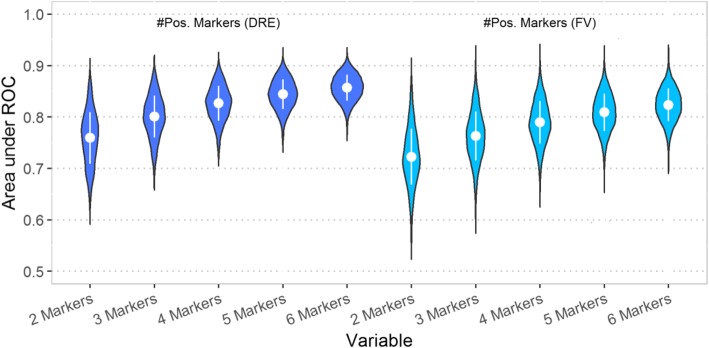
Fig. 1.
Violin plot of AUCs obtained for two, three, four, five, and six marker combinations. Violin plots of the AUCs of all two to six marker combinations using as a variable the number of positive markers. The inner part of each note shows the mean ± 1 SD. As the number of markers increases, the AUC values increase and the range of AUC values decreases

