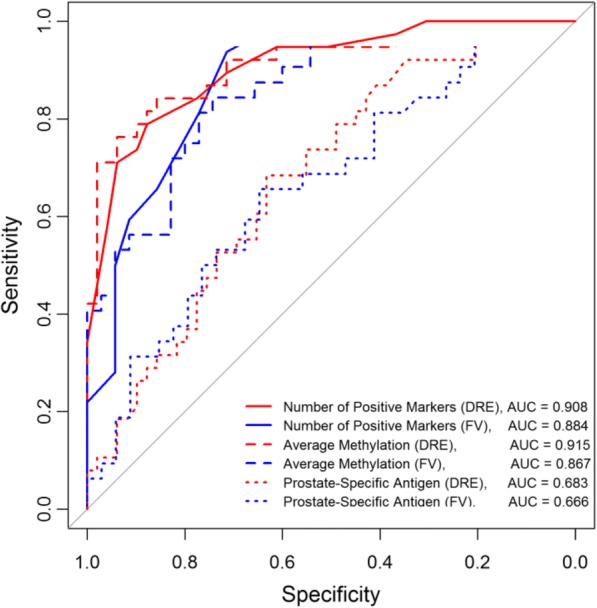
Fig. 2.

Receiver operating characteristics (ROC) curves based on the number of methylated markers and their methylation levels generated with the FV and DRE data for all 19 markers. The ROC curves obtained from DRE and FV DNAs based on the number of positive markers and the average methylation. The ROC curves for PSA were also shown for comparison
