Fig. 3.
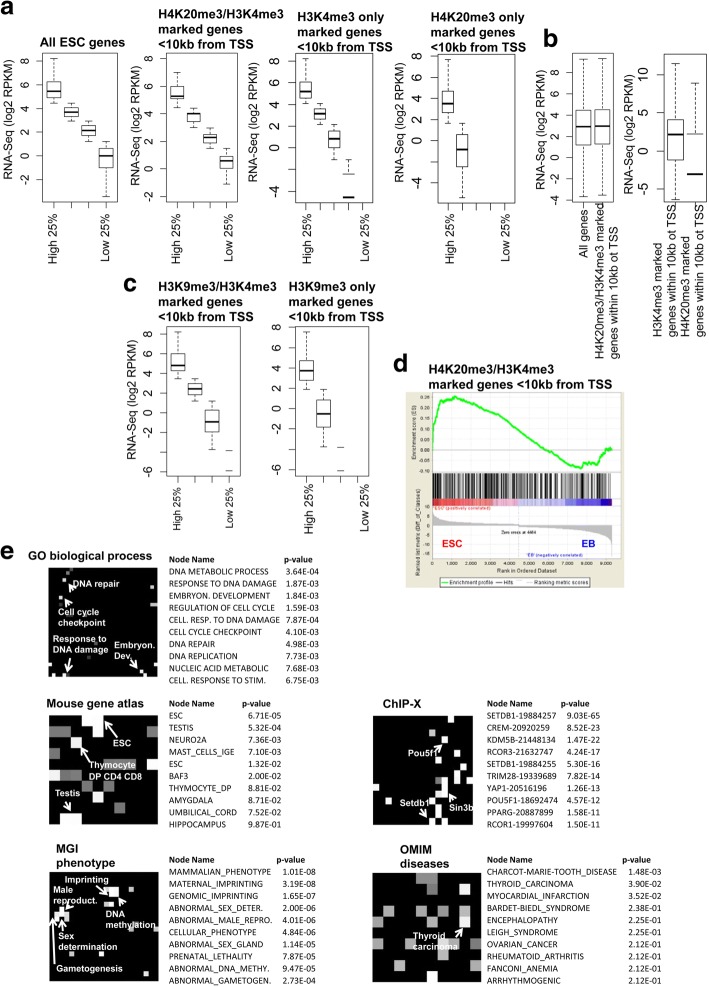
Expression and network analysis of H4K20me3/H3K4me3 associated genes. a Boxplot of RNA-Seq expression data for all genes in ES cells (left), genes containing H4K20me3/H3K4me3 marks, genes with only H3K4me3 marks, and genes with only H4K20me3 marks within 10 kb of TSS. All genes, or genes containing H4K20me3/H3K4me3, H3K4me3-only, or H4K20me3-only were divided into quartiles based on their expression in ES cells. b Boxplot of RNA-Seq expression data for all genes and genes containing H4K20me3/H3K4me3 marks within 10 kb of TSS (right). c Boxplot of RNA-Seq expression data for genes containing H3K9me3/H3K4me3 marks and genes with only H3K9me3 marks within 10 kb of TSS (middle). d Gene set enrichment analysis (GSEA) of H4K20me3/H3K4me3 co-marked genes in ES cells relative to differentiated embryoid bodies (EBs). e Network2Canvas analyses of genes containing H4K20me3/H3K4me3 marks within 10 kb of TSS. Each node (square) represents a gene list (H4K20me3/H3K4me3 co-occupied genes associated with a gene-set library (Gene ontology (GO) biological process, mouse gene atlas, MGI phenotype, ChIP-X or OMIM diseases). The brightness (white) of each node is determined by its P-value

