Fig. 4.
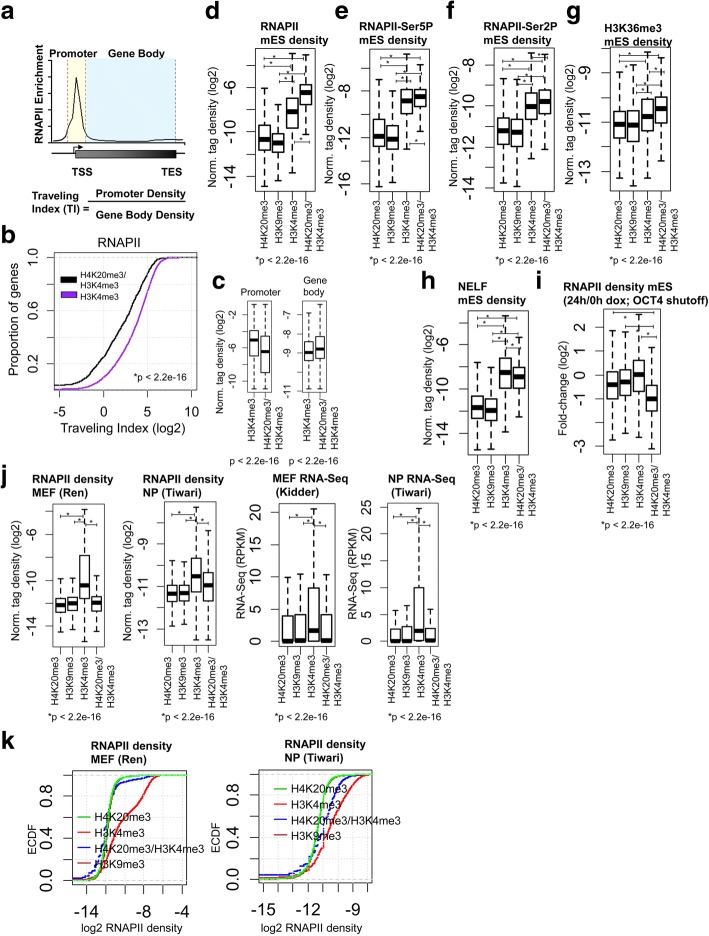
H4K20me3/H3K4me3 marks transcriptionally dynamic genes in ES cells. a Schematic describing the calculation used to determine the traveling index (TI) at RNAPII marked genes in ES cells. The promoter bin is defined as a 1 kb window around the TSS of genes marked by RNAPII, while the transcribed region (gene body) is defined as the region extending to the TES. The TI is calculated from the ratio of the density of RNAPII in the promoter bin to the density of RNAPII in the gene body bin. b Empirical cumulative distribution for the TI of RNAPII across H4K20me3/H3K4me3 (black) and H3K4me3 (purple) marked genes in ES cells. Y-axis shows the percentage of genes that exhibit a TI less than the value specified by the x-axis. A line shifted to the left means a systematic decrease in the traveling index. p-value < 2.2e-16 (Kolmogorov-Smirnov test). Note the decreased TI for genes marked by H4K20me3/H3K4me3. c Boxplot of RNAPII density in promoter (left) and gene body (right) regions at H4K20me3/H3K4me3 and H3K4me3 regions. d-h Boxplots of (d) RNAPII, e RNAPII-Ser5P, f RNAPII-Ser2P, g H3K36me3, and (h) NELF densities at H4K20me3/H3K4me3, H3K4me3, H4K20me3, and H3K9me3 regions in ES cells. i-j Boxplots of RNAPII density (i) 24 h following OCT4 shutdown in ZHTBc4 ES cells and in (j) mouse fibroblasts (left) and neural progenitors (right). k Empirical cumulative distribution function (ECDF) for RNAPII density in mouse fibroblasts (left) and neural progenitors

