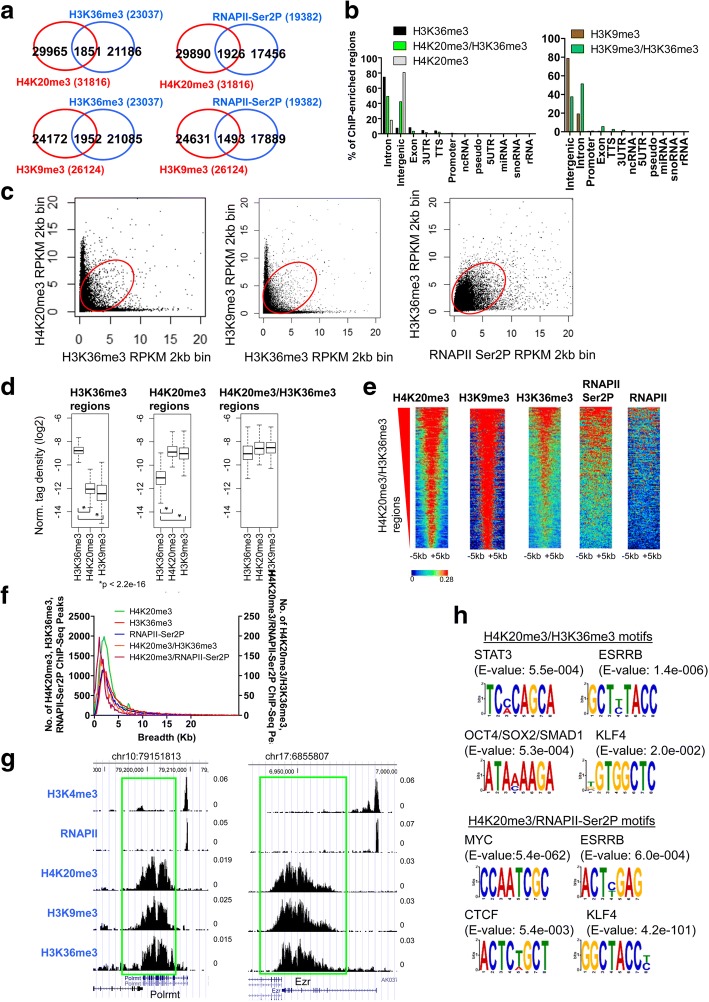
Fig. 5.
H4K20me3 co-localizes with H3K36me3 in gene body regions of a subset of active genes in ES cells. a Venn diagram showing overlap between H4K20me3 and H3K36me3, H4K20me3 and RNAPII-Ser2P, H3K9me3 and H3K36me3, and H3K9me3 and RNAPII-Ser2P co-occupied regions. b Annotation of H4K20me3 and H3K36me3, and H3K9me3 and H3K36me3 co-occupied regions using HOMER software. Scatter plot of (c) H4K20me3 and H3K36me3 densities (RPKM), and H3K9me3 and H3K36me3 densities at 2 kb genomic bin intervals. d Density of H3K36me3, H4K20me3, and H3K9me3 at H3K36me3 peaks (left panel), H4K20me3 peaks (middle panel), and H4K20me3/H3K36me3 intersecting regions (right panel). e Heat maps of H4K20me3, H3K9me3, H3K36me3, RNAPII-Ser2P, and RNAPII densities at H4K20me3/H3K36me3 marked regions. Rows were sorted by the level of H4K20me3 at H4K20me3/H3K36me3 regions. f Distribution of H4K20me3, H3K36me3, RNAPII-Ser2P, H4K20me3/H3K36me3, and H4K20me3/RNAPII-Ser2P co-occupied ChIP-Seq peaks in ES cells. g UCSC browser view of H4K20me3, H3K9me3, and H3K36me3 co-occupancy in ES cells. h Enriched DNA binding motifs in H4K20me3/H3K36me3 co-occupied regions identified using MEME-ChIP software

