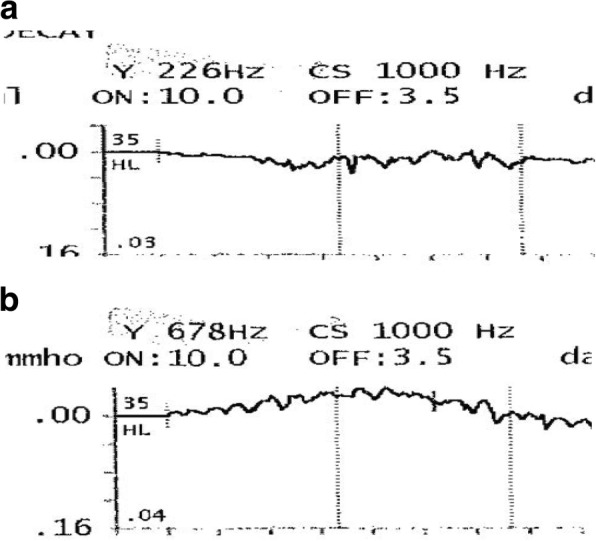
Fig. 1.

a and b Tympanogram tracings of a healthy ET subject during testing with 226 Hz (a) and 678 Hz (b) probe tone. The y-axis represents middle ear compliance (MEC), measured in mL or mmho. The x-axis represents time, measured in seconds (s). A detailed outline of the procedure is described in the “Data Collection” section of this manuscript. Based on an algorithm used by the creators of the TympStar, the maximum MEC during testing is calculated. The tracings indicate movement of the TM with each respiration
