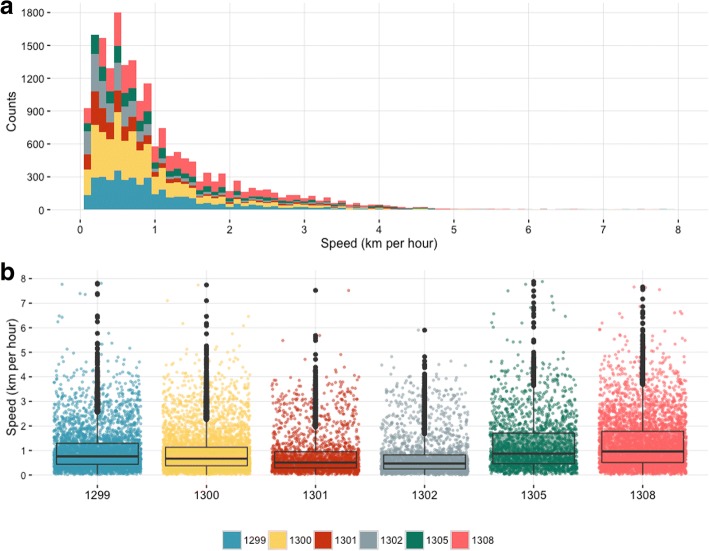
Fig. 2.
Speed of movement of the transhumant herds tracked between October 2014 and May 2015 in Central Cameroon (in km/hour). a: Distribution of the recorded speed of movements at each GPS captured location for the tracked cattle (km/hour on the x-axis and counts on the y-axis). b: Boxplot of the recorded speed of movements at each GPS captured location for each tracked cattle (x axis). For each box the dots refer to the recorded speed at each GPS captured location, the upper and lower hinges correspond to the 1st and 3rd quartiles (the 25th and 75th percentiles) and the horizontal line to the median value

