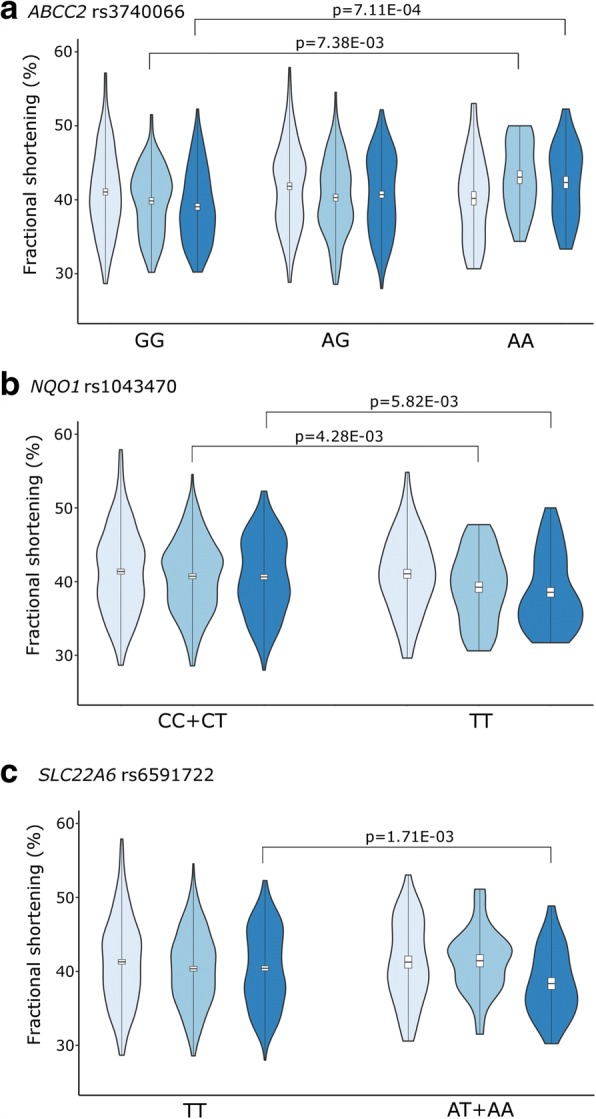
Fig. 3.

Violin plot of fractional shortening in the total population. FS (%) by genotypes is shown in different follow-up categories. Light blue is the time of diagnosis, medium blue is the time of the anthracycline administration (acute phase), dark blue is the follow-up 5–10 years after therapy. FS is indicated in box plots, box is mean ± S.D., whiskers are means ±3 S.D. Violin plot describes the distribution of FS data, records out of mean ± 3SD are not shown. A: ABCC2 rs3740066; B: NQO1 rs1043470; C: SLC22A6 rs6591722
