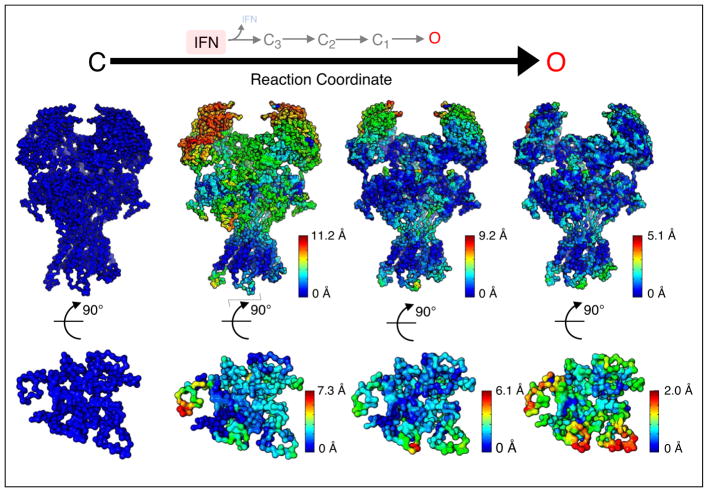
Figure 3.
Proposed structural model of NMDA receptor activation. Top, sequence of kinetic transitions initiated by IFN dissociation from IFN-bound closed conformations into IFN-free closed (C3, C2, C1) and open (O) states, according to kinetic models derived from single-channel electrical measurements. Middle, sequence of structural changes initiated by IFN dissociation from the IFN-bound closed structure (based on PDB 4PE5) into IFN-free closed and open conformations (based on PDB 5FXG), as proposed by coarse-grain and transition pathway modeling [56]. Spheres represent the alpha carbon of each residue; for each transition, structural motions were mapped onto the structure and color-coded according to their relative magnitude. Bottom, intracellular view of the transmembrane domain.

