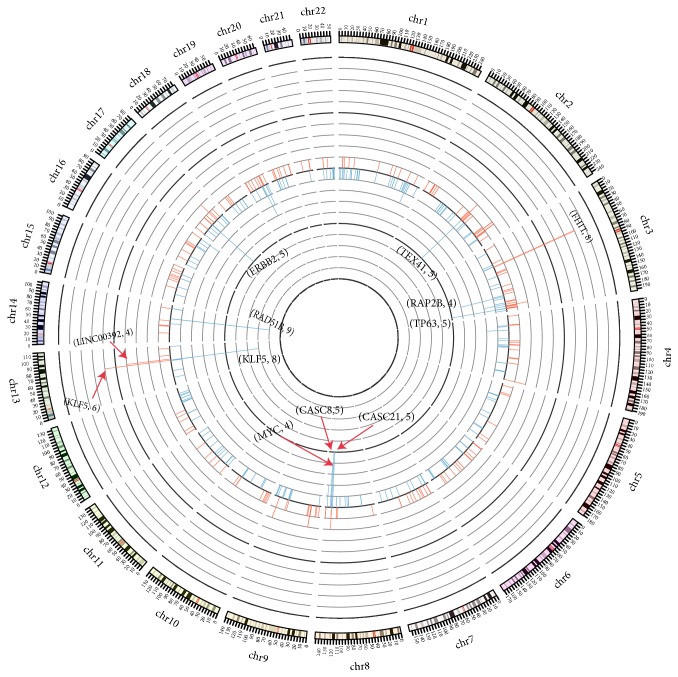
Figure 1.
Gene frequency integrated by HPV between RNA and DNA samples. The figure showed the difference of gene frequency in DNA and RNA samples. The inner circle revealed the gene frequency (blue color) in RNA samples and the outer circle revealed the gene frequency (red color) in DNA samples. The height represented the frequency of gene integrated by HPV.

