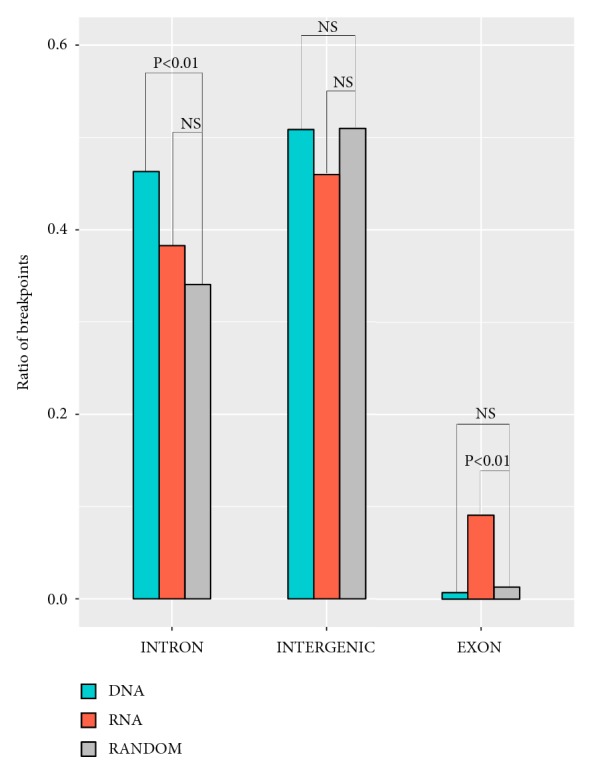
Figure 2.

Distribution of breakpoints in genetic elements. The ratio of breakpoints in each genome element was counted. The expected ratio of each genome elements was calculated according to the random distribution of breakpoints in the whole human genome. Grey bar represented the expected ratio of breakpoints. Orange bar represented the observed ratio of breakpoints in RNA samples. Green bar represented the observed ratio of breakpoints in DNA samples. P values were calculated by Chi-squared test and were corrected by Fisher exact test.
