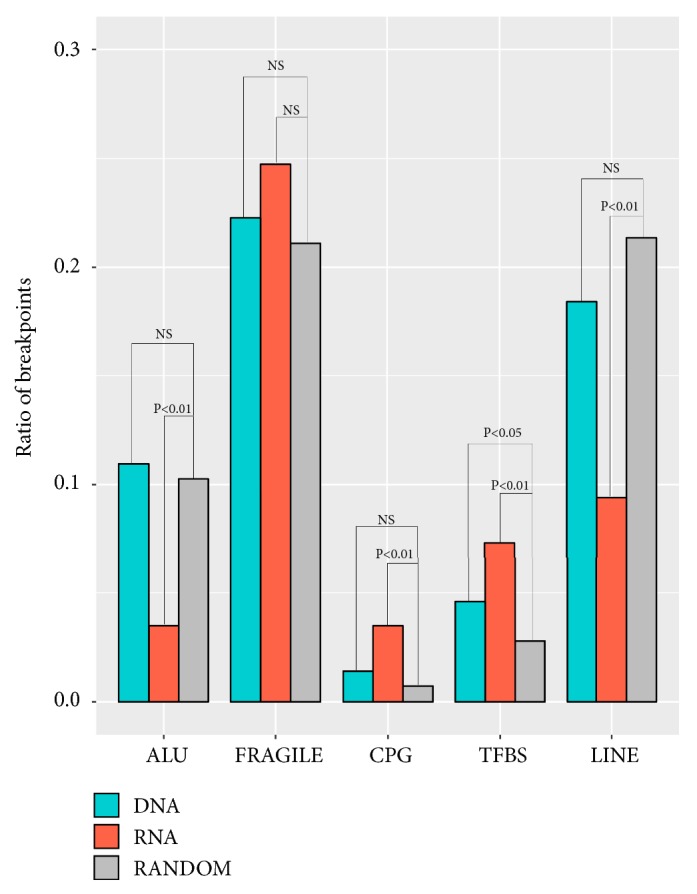
Figure 3.

Distribution of breakpoints in the region of Fragile, CPG, TFBS, ALU, TFBS, and LINE. X axis represented different elements; Y axis represent ratio of integration breakpoints. The expected (random distribution, Grey) and the observed (actual ratio, RNA samples: orange; DNA samples: green) percentages of breakpoints are shown. P values were calculated by Chi-squared test and also were corrected by Fisher exact test.
