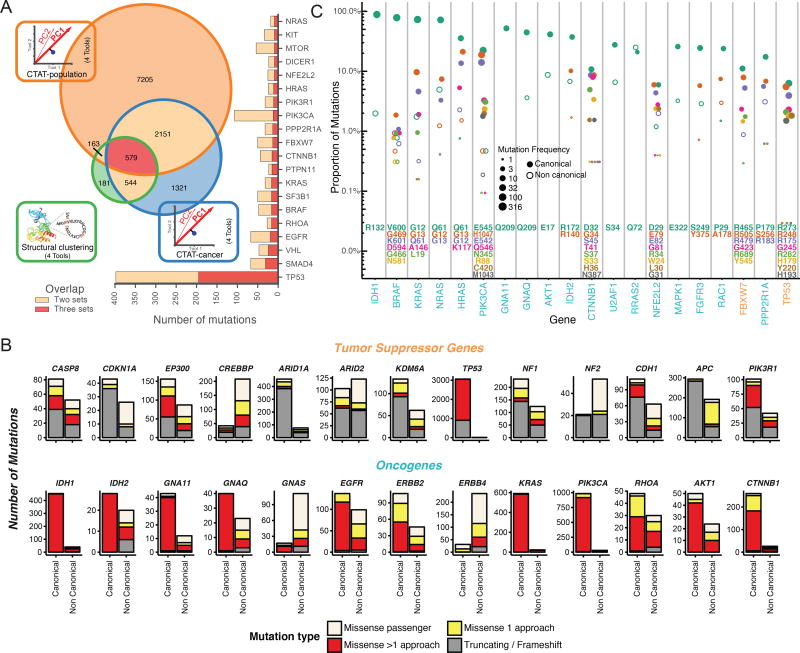
Figure 3. Driver mutation discovery approaches, overview, overlap, and contrasts.
(A) Venn diagram indicates total number of mutations overlapping among three consensus approaches: CTAT-population, CTAT-cancer, and structural clustering. Adjacent bar chart indicates the top 20 genes sorted by 3-set intersecting mutation counts. (B) Driver gene discovery identified gene-tissue pairs (canonical genes) in tumor suppressors and oncogenes. However, some gene-tissue pairs were not identified in driver discovery (non-canonical). Mutation frequency from canonical and non-canonical cancer genes are displayed and divided among 4 mutation classes: truncation/frameshift mutations (grey); missense mutations uniquely identified by only one approach (yellow, see Panel A); missense mutations identified by multiple approaches (red, see Panel A); and missense passenger mutations not identified by any approach (off white). (C) Mutation percentage out of all missense and truncating/frameshift mutations within a gene is shown on the y-axis (log scale). Point size is log scaled and represents amino acid position frequency. The top 23 genes ordered by increasing mutational diversity (normalized entropy) and only the 9 most frequently mutated amino acid positions for each gene are shown. See also Figure S5 and Table S4.

