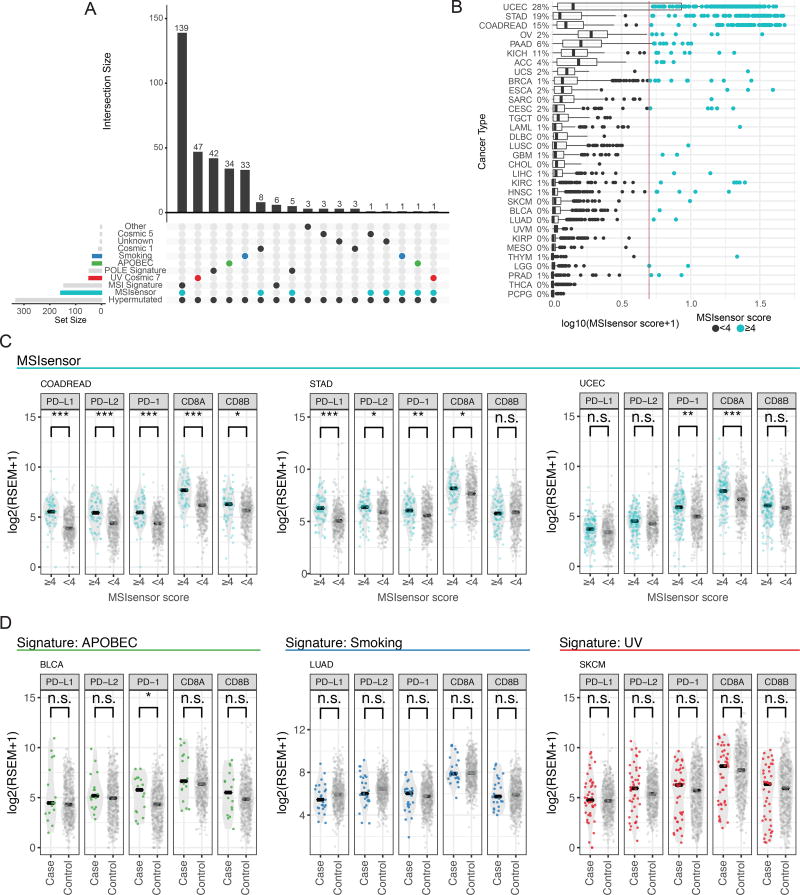
Figure 5. Hypermutators exhibit multiple signatures, microsatellite instability, and immune infiltration expression.
(A) UpSetR(Conway et al., 2017) plot highlights the intersection of multiple signatures and phenotypes with hypermutated samples. (B) MSI scores segregated by cancer types. MSI-score threshold is displayed with a vertical line. The percentage of samples with high MSI is displayed to the right of each cancer type. (C, D) RNA-Seq abundance of different immune biomarkers across signatures and MSI phenotypes defined by MSIsensor. Stars indicate significance levels using a two-sided t-test to calculate p-values (* < 0.05, ** < 0.01, *** < 0.001). See also Figure S6 and Table S5.

