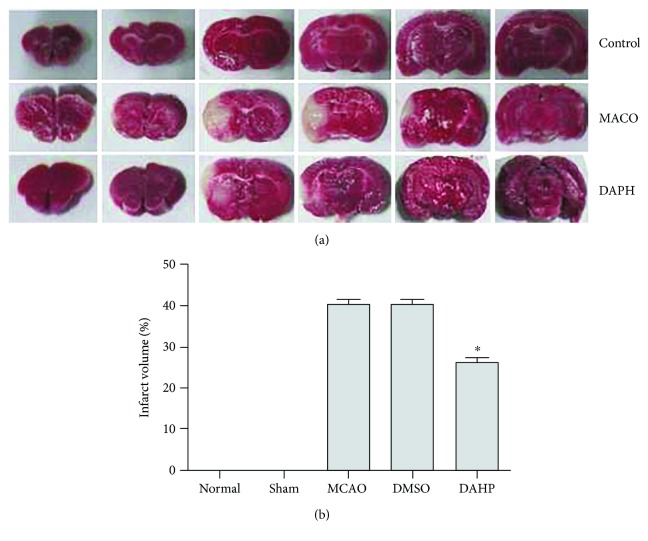
Figure 2.
(a) Unstained areas (negative TTC stains) were defined as infarct regions, while normal regions appeared red. (b) Bar graph represents the infarct volume from TTC staining in various groups (mean ± SEM, n = 6, ∗P < 0.05 versus the DAHP-treated group). Infarct volume markedly decreased in the DAHP-treated group, compared with the MCAO group (n = 6, ∗P < 0.05 versus the DAHP-treated group).

