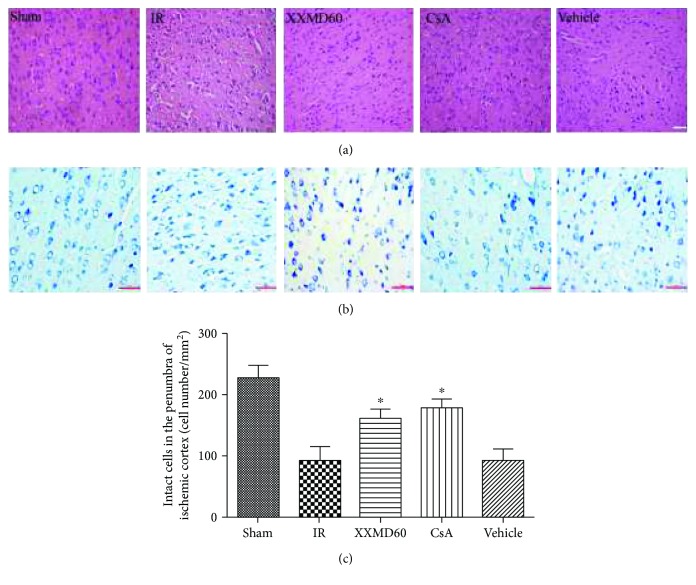
Figure 2.
Histological changes of the penumbra of the ischemic cortex by groups. (a) HE images of cortical sections in different groups. (b) Representative images of Nissl staining in different groups. (c) Analysis of intact cells in the penumbra of the ischemic cortex. The number of intact cells in the XXMD60 group and CsA group was significantly higher than that in the IR group. Data are reported as the means ± SEM. n = 5; ∗p < 0.05 versus the IR group. Scale bar = 50 μm.

