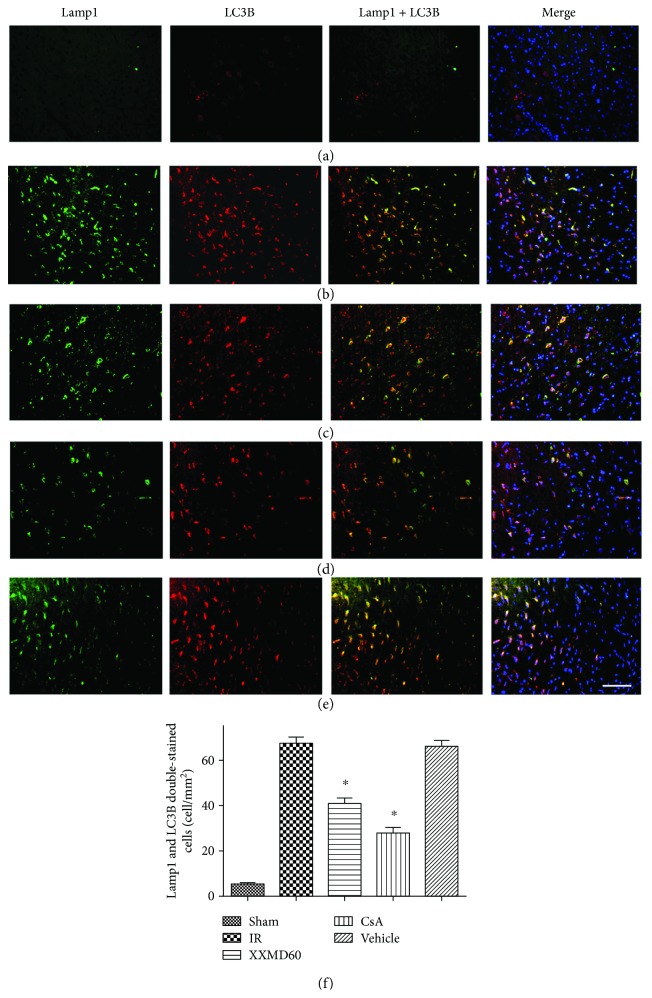
Figure 6.
Double immunofluorescence staining for LC3B and Lamp1 of different groups in the penumbra of the ischemic cortex at 24 h after reperfusion. LC3B (red) immunostaining that colocalized in Lamp1-positive cells (green) indicating autophagic lysosomes. (a) Representative microphotographs of rats in the Sham group. (b) Representative microphotographs of rats in the IR group. (c) Representative microphotographs of rats in the XXMD60 group. (d) Representative microphotographs of rats in the CsA group. (e) Representative microphotographs of rats in the Vehicle group. (f) Quantification of Lamp1 and LC3B double-stained cells. n = 4, scale bar = 50 μm. ∗p < 0.05 versus the IR group.

