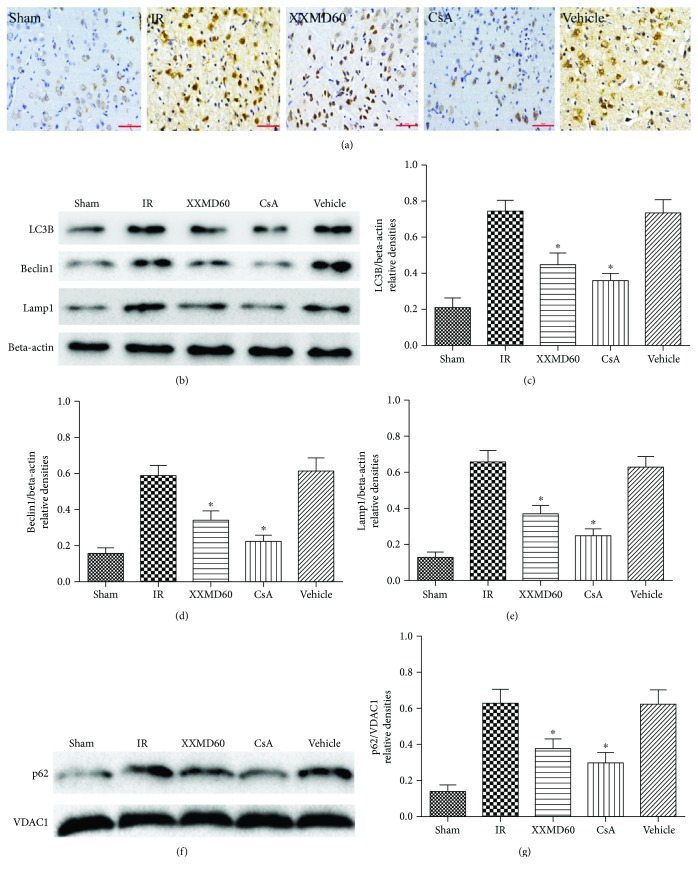
Figure 7.
Beclin1 immunohistochemistry and expression levels of LC3, Beclin1, Lamp1, and mitochondrial p62 at 24 h after reperfusion following 90 min of cerebral ischemia. (a) Representative microphotographs of immunohistochemistry for Beclin1. (b) Western blots of LC3, Beclin1, and Lamp1. Beta-actin bands were the internal control. (c) Quantitative evaluation of LC3B. (d) Quantitative evaluation of Beclin1. (e) Quantitative evaluation of Lamp1. (f) Western blot of p62 in the mitochondrial fraction. VDAC1 bands were the internal control. (g) Quantitative evaluation of mitochondrial p62. Data are reported as the means ± SEM. n = 4, ∗p < 0.05 versus the IR group.

