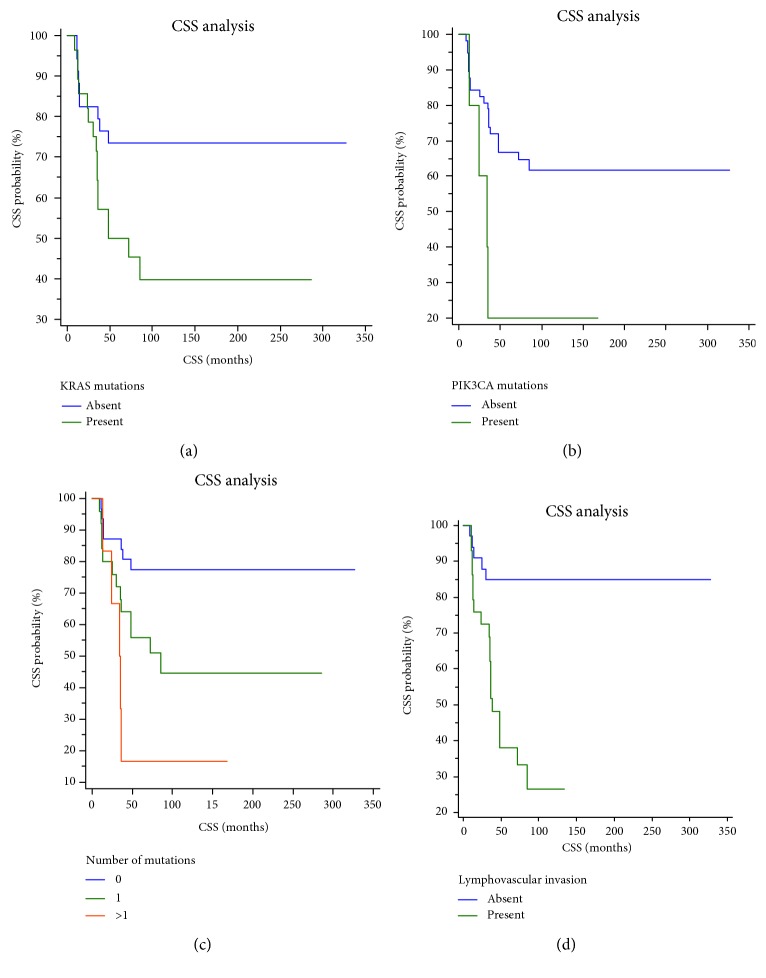
Figure 2.
(a–c) Kaplan-Meier curves showing CSS of patients with pTNM stage I CRC according to mutational status of KRAS, BRAF, and PIK3CA genes. Patients having CRC with (a) KRAS, (b) PIK3CA, or (c) 2 or 3 mutations had significantly lower CSS, compared to patients with CRC with absent or 1 mutation. (d) Kaplan-Meier curves showing CSS of patients with pTNM stage I CRC according to the presence of LVI. Patients having CRC with LVI had significantly lower CSS compared to patients with CRC not having LVI.

