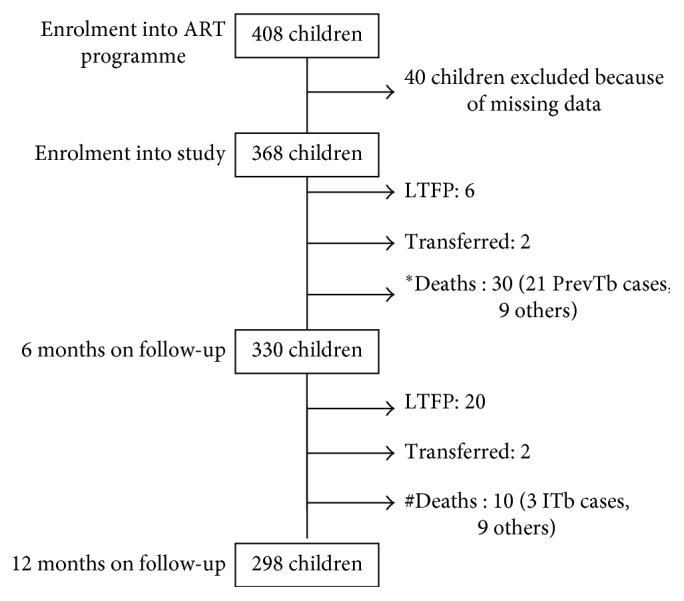
Figure 1.

Schematic diagram of the follow-up of the children over 12 months of highly active antiretroviral therapy. ∗17.3 deaths per 100 child-years; #3.0 deaths per 100 child-years. ART = antiretroviral therapy, PrevTb = prevalent tuberculosis, ITB = Incident tuberculosis, and TFP = lost to follow-up.
