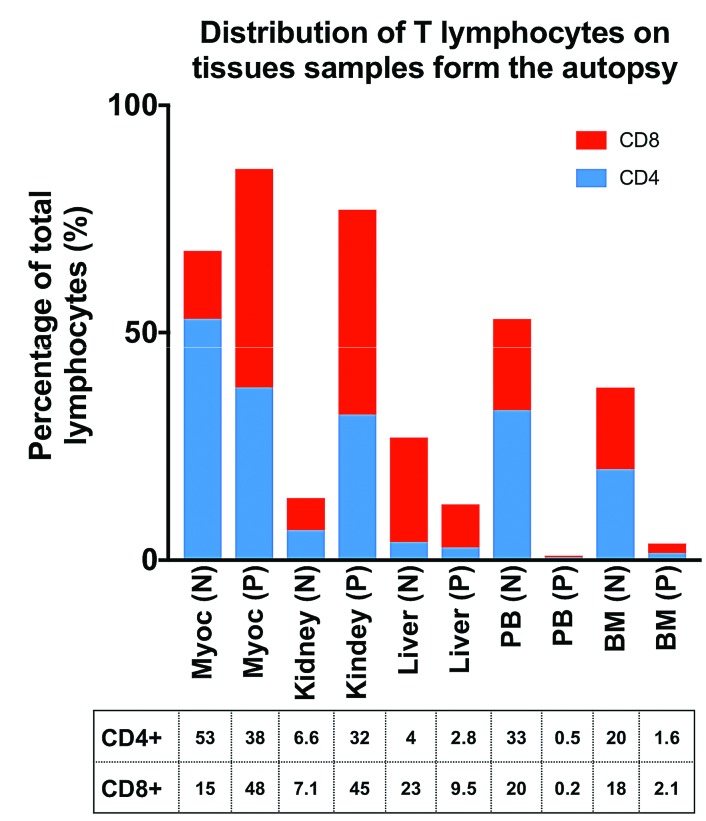
Figure 3.
Comparative analysis of T-cell subsets from autopsy samples. Flow cytometry analysis of CD8+ (red) and CD4+ (blue) T-cell subset frequencies on different tissue samples. Bars represent percentage of total lymphocytes. Myoc: Myocardium; PB: Peripheral Blood; BM: Bone Marrow; N: Normal values; P: Patient. For comparison, normal values were extracted from literature: Myocardium (PMID: 9024980); Kidney (PMID: 18765477); Peripheral Blood (PMID: 10366792); Bone Marrow (PMID: 1700596).

